


Trend analysis (Fig. 1).
Today, the market from the level of 1.2929 (closing of yesterday's daily candlestick) will attempt to continue moving down with the goal of 1.2868, which is a pullback level of 61.8% (red dotted line). When this level is reached, the price may resume moving down to the next target of 1.2794, which is a pullback level of 76.4% (red dotted line).
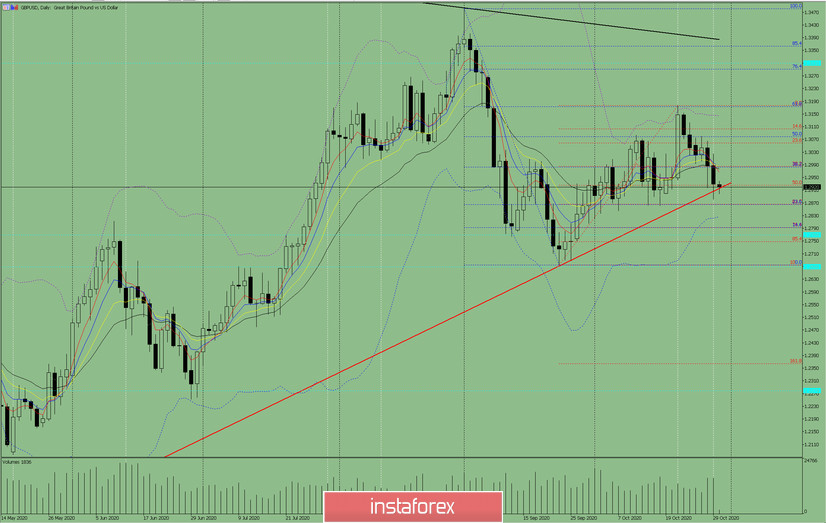
Figure 1 (Daily chart).
Comprehensive analysis:
- Indicator analysis - down
- Fibonacci levels - down
- Volumes - down
- Candlestick analysis - down
- Trend analysis - up
- Bollinger bands - down
- Weekly chart - up
General conclusion:
Today, the price from the level of 1.2929 (closing of yesterday's daily candlestick) will attempt to continue moving down with the goal of 1.2868, which is a pullback level of 61.8% (red dotted line). When this level is reached, the price may continue to move down to the next target of 1.2794, which is a pullback level of 76.4% (red dotted line).
Alternative scenario: from the level of 1.2929 (closing of yesterday's daily candlestick), the price will start moving up to reach the pullback level of 38.2% - 1.2983 (blue dotted line). When testing this level, there will be a continuation of the upward movement to the next target 1.3078, which is a pullback level of 50.0% (blue dotted line).


