


Trend analysis (Fig. 1).
Today, the market will try to start moving down from the level of 1.1823 (the closing of yesterday's daily candle) with the goal of 1.1798 which is a pullback level of 23.6% (red dotted line). In the case of testing this level, work up to the level of 1.1860 which is the resistance line (white bold line). If successful, further work up to 1.1880 is the upper fractal (candle from 21.10.2020).
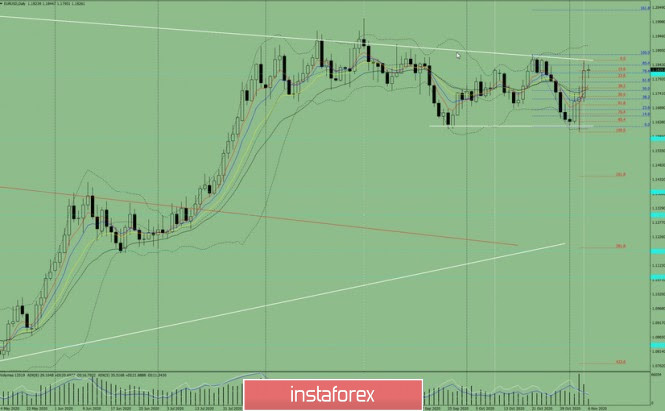
Figure 1 (daily chart).
Complex analysis:
- Indicator Analysis – up
- Fibonacci Levels – up
- Volumes – up
- Candle Analysis – up
- Trend Analysis – up
- Bollinger Bands – up
- Weekly Chart – up
General conclusion:
The price, from the level of 1.1673 (the closing of yesterday's daily candle), will try to start moving down with the goal of 1.1798 which is a pullback level of 23.6% (red dotted line). In the case of testing this level, work up to the level of 1.1860 which is the resistance line (white bold line). If successful, further work up to 1.1880 upper fractal (candle from 21.10.2020).
Alternative scenario: From the pullback level of 14.6% - 1.1823 (red dotted line), the upward movement may continue with the target of 1.1860 which is the resistance line (white bold line). In the case of testing this line, work down to the level of 1.1798 which is a pullback level of 23.6% (red dotted line).


