


Trend analysis (Fig. 1).
Today, the market from the level of 1.3148 (closing of yesterday's daily candlestick) will make an attempt to start moving down with the goal of 1.3104 - a pullback level of 14.6% (red dotted line). Upon reaching this level, the price can continue to move up with the goal of 1.3177 - the upper fractal (candle from 21.10.2020).
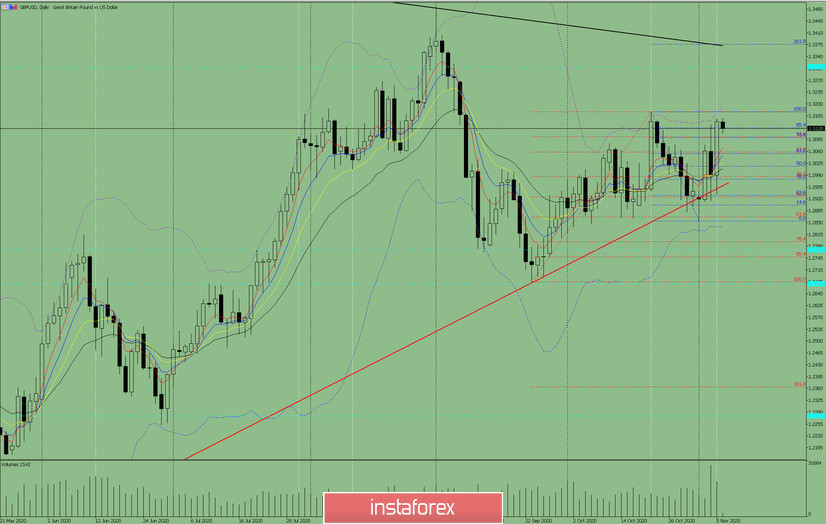
Figure 1 (Daily chart).
Comprehensive analysis:
- Indicator analysis - up;
- Fibonacci levels - up;
- Volumes - up;
- Candlestick analysis - down;
- Trend analysis - up;
- Bollinger bands - up;
- Weekly chart - up.
General conclusion:
Today, the price from the pullback level of 14.6% - 1.3104 (red dotted line) will try to continue moving up with the goal of 1.3177 - the upper fractal (candle from 21.10.2020).
Upon reaching this level, work upward to the goal of 1.3310 - the historical resistance level (blue dotted line).
Unlikely scenario: from the level of 1.2929 (closing of yesterday's daily candlestick), the price will start moving down to reach the pullback level of 23.6% - 1.3058 (red dotted line). When testing this level, the price will continue moving down to the next target of 1.2985 - a pullback level of 38.2% (red dotted line).


