


To open long positions on EURUSD, you need to:
The data released today on German inflation and the volume of industrial production in the Eurozone did not surprise traders much, so there were no many people who wanted to sell the euro. Against this background, the bulls made a successful attempt to regain the resistance of 1.1797, which no major seller expressed any desire to protect in any way. As a result, we did not receive the expected signal to sell the euro. There was also no place to buy EUR/USD, since after the breakout of 1.1797, the euro grew, and we did not wait for the reverse movement to the level of 1.1797. Perhaps it will happen in the second half of the day after inflation data of the USA.
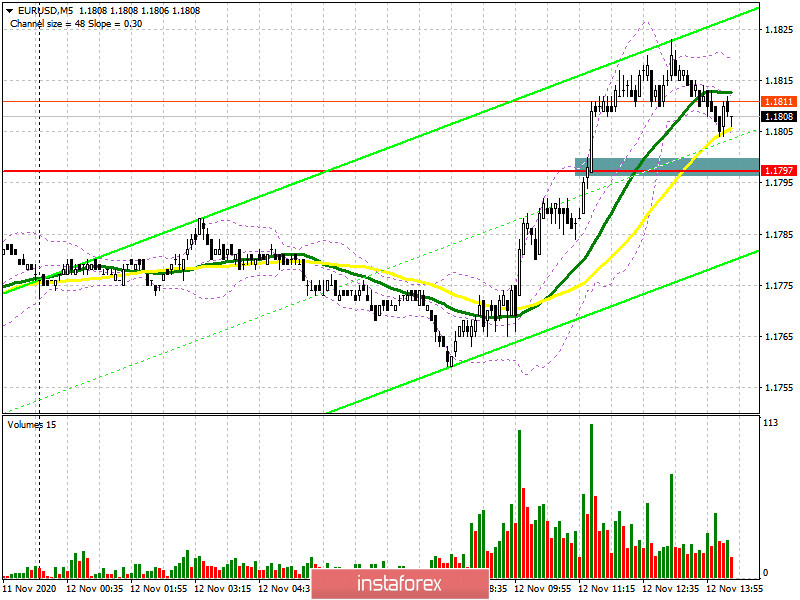
If euro buyers still manage to protect the support of 1.1797 during the release of the US inflation report, then the formation of a false breakout at this level will be a good entry point into long positions to further restore the pair to the resistance area of 1.1860, where I recommend fixing the profits. The longer-term target will be a weekly high of 1.1915. If the bulls do not show much activity, and the data turns out to be much better than economists' forecasts, a return of EUR/USD to the level of 1.1797 is not excluded. In this case, in the second half of the day, buyers will focus on protecting the support of 1.1743. However, it is only possible to open long positions on the first test based on a correction of 15-20 points within the day. A larger reversal in favor of buyers will occur if they manage to form a false breakout at 1.1743.
To open short positions on EURUSD, you need to:
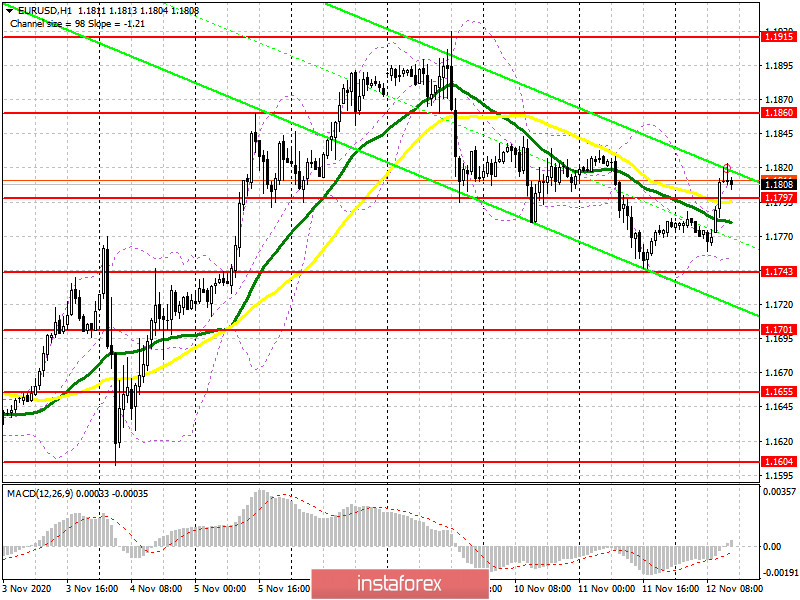
The initial task of sellers is to regain the level of 1.1797, which they managed to miss in the first half of the day after the release of fundamental indicators for the Eurozone. Only a consolidation below 1.1797 and its test on the reverse side from the bottom up form a more convenient entry point for the continuation of the downward trend. In this case, the nearest target of the bears will be at least 1.1743. A test of this level will indicate the actual formation of a new bear market for EUR/USD. However, only a break in this area will increase the pressure on the pair and quickly push it to a minimum of 1.1701, where I recommend fixing the profits. If the bulls are stronger and continue to push the pair up after the US data, then it is best not to rush to sell, but wait for the update of the larger resistance at 1.1860. I recommend selling EUR/USD immediately for a rebound from the maximum of 1.1915, based on a correction of 15-20 points within the day.
Let me remind you that the COT report (Commitment of Traders) for November 3 recorded a reduction in long positions and an increase in short positions. But despite this, buyers of risky assets believe in the continuation of the bull market, although they prefer to act cautiously. Thus, long non-profit positions decreased from 217,443 to 208,237, while short non-profit positions rose to 67,888 from 61,888. The total non-commercial net position fell to 140,349 from 155,555 a week earlier. It is worth noting that bullish sentiment on the euro in the medium term remains quite high, especially after the victory of Joe Biden, who intends to give the American economy the next largest monetary aid package in the amount of more than 2 trillion US dollars.
Signals of indicators:
Moving averages
Trading is just above 30 and 50 daily moving averages, indicating that the bulls are trying to regain control of the market.
Note: The period and prices of moving averages are considered by the author on the hourly chart H1 and differ from the general definition of classic daily moving averages on the daily chart D1.
Bollinger Bands
If the pair declines, the lower limit of the indicator around 1.1755 will act as support, from which you can buy euros.
Description of indicators
- Moving average (moving average determines the current trend by smoothing out volatility and noise). Period 50. The graph is marked in yellow.
- Moving average (moving average determines the current trend by smoothing out volatility and noise). Period 30. The graph is marked in green.
- MACD indicator (Moving Average Convergence / Divergence - moving average convergence / divergence) Fast EMA period 12. Slow EMA period 26. SMA period 9
- Bollinger Bands (Bollinger Bands). Period 20
- Non-profit speculative traders, such as individual traders, hedge funds, and large institutions that use the futures market for speculative purposes and meet certain requirements.
- Long non-commercial positions represent the total long open position of non-commercial traders.
- Short non-commercial positions represent the total short open position of non-commercial traders.
- Total non-commercial net position is the difference between the short and long positions of non-commercial traders.


