GBP/USD 1H

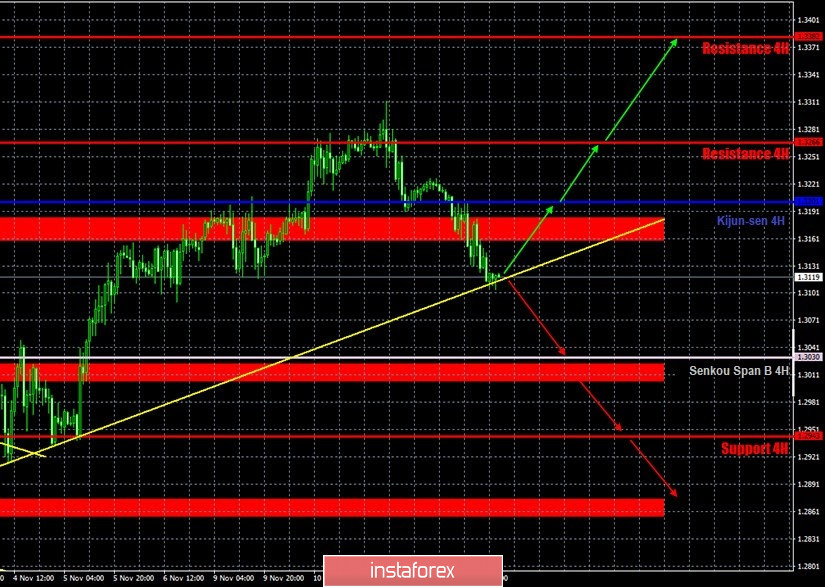
The GBP/USD pair continued to correct throughout Thursday, November 12, and it reached an upward trend by the end of the day. Therefore, the upward trend is still present, as evidenced by the fact that the price is above the trend line. Bears remain rather weak for now, while bulls continue to dominate the market. Nevertheless, the EUR/USD pair has been falling for two consecutive days. If it does not rebound off the trend line, then we will write off the last two days' decline as a deep correction instead. Otherwise, the bears can take over the initiative in the market. Take note that the outlook for the pound remains vague due to the fundamental background from the UK. It is even difficult to say what exactly pushed the pair in recent weeks, since Great Britain did not particularly provide any information. Yes, the pound could have been supported by the fact that the House of Lords of the British Parliament rejected the Johnson Bill. However, this is an isolated case. As for the US presidential election, the markets have already digested this information, so it's time for the pound to start falling. We are leaning towards the option that the trend line will be broken.
GBP/USD 15M

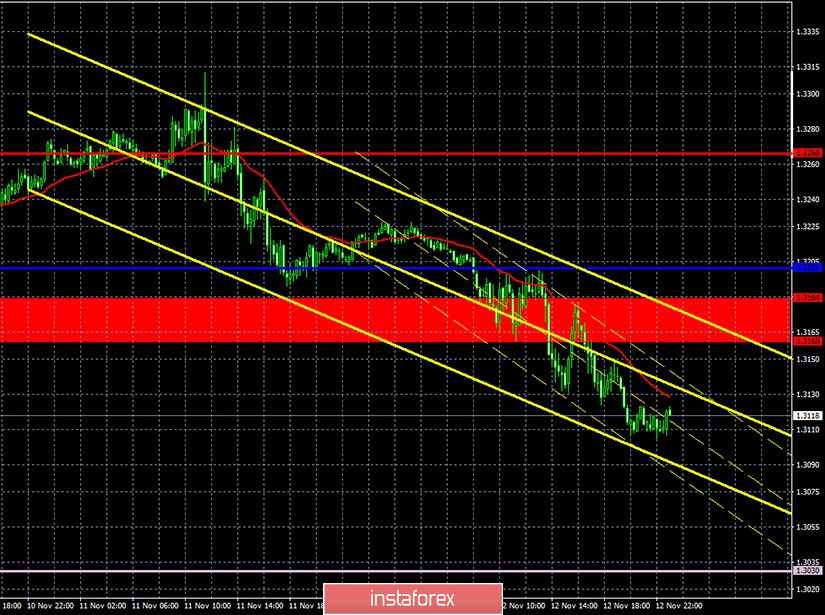
Both lower linear regression channels turned to the downside on the 15-minute timeframe, signaling an ongoing downward correction. The pair's quotes managed to overcome both the Kijun-sen line and the support area of 1.3160-1.3184. Therefore, a succeeding decline is only limited by the trend line on the hourly timeframe.
COT report

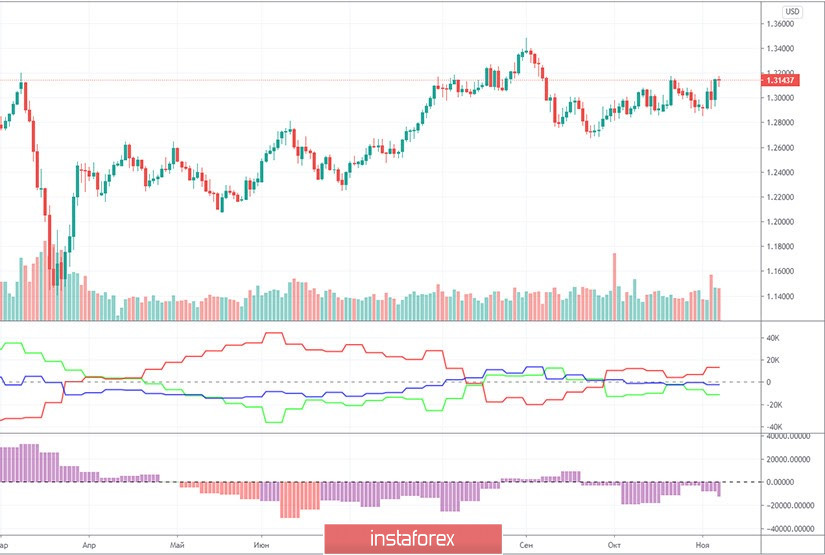
The GBP/USD pair only lost 100 points during the last reporting week (October 27-November 2). The pound began to rise after November 2. And it wasn't so much of a rise, but more like the dollar's fall. However, let's go back to the reporting period. Non-commercial traders closed 3,281 Buy-contracts (longs) and opened 1,146 Sell-contracts (shorts). Thus, the net position for the "non-commercial" group of traders decreased by 4,500. This is much more clearly visible on the chart of the first indicator. The green and red lines, which represent the net positions of the two most important groups of traders, began to diverge in different directions. Therefore, the mood of professional traders is becoming more bearish again. However, this change did not result in the pound's decline. Because elections were already held in the United States on November 3 and the dollar was only getting cheaper then. Therefore, the new Commitment of Traders (COT) report may show that the bearish mood is weakening among professional traders. However, in any case, we believe that the markets need to calm down and only after that will it be possible to look at all the information in a new way. It is now clear that market participants are in a very agitated state due to the political chaos that is now present in the United States. Therefore, the mood of large traders can change quickly and dramatically.
The latest fundamentals for the British pound were disappointing. We have repeatedly listed all the problems of the British economy. And macroeconomic statistics regularly confirm this weakness. The third quarter GDP was released yesterday. The growth in quarterly terms was 15.5%. In annual terms, the reduction was 9.6%. The growth for the month of September was 1.1%. All three indicators turned out to be worse than analysts' forecasts. In addition, industrial production in the UK grew by only 0.5% m/m and decreased by 7.9% in annual terms. Both values are also worse than forecasted. Bank of England Governor Andrew Bailey mentioned in his speech that the economy will recover from the coronavirus criss no earlier than the first half of 2022. He also noted the progress in the creation of a vaccine by Pfizer and expressed hope that the drug will soon enter mass production. On the whole, his speech was quite neutral. As did the speech of US Federal Reserve Chairman Jerome Powell, who also spoke more about the vaccine than about the economy. Powell, however, warned the markets against being overly optimistic. He stated that despite the development of a vaccine, the next few months will still be quite difficult.
No major events scheduled for Friday in the UK. Therefore, traders will have to monitor news regarding Brexit, negotiations between Brussels and London, as well as any news from Donald Trump, who is extremely calm in the days after the elections. From a technical point of view, we are still waiting for the pound to drop. The main thing is that the fundamental background does not interfere with this.
We have two trading ideas for November 13:
1) Buyers for the pound/dollar pair were unable to overcome the resistance level of 1.3266 and fell to the upward trend line, which is still in force. Thus, we advise you to buy the pair if it rebounds from this line, while aiming for the Kijun-sen line (1.3201) and the resistance levels of 1.3266 and 1.3382. Take Profit in this case will be from 50 to 230 points.
2) Sellers do not own the initiative in the market. If the price settles below the trend line, the trend will change to a downtrend and then you can sell the pound/dollar pair while aiming for the Senkou Span B line (1.3030) and the support level of 1.2943. Take Profit in this case can range from 60 to 140 points.
Hot forecast and trading signals for EUR/USD
Explanations for illustrations:
Support and Resistance Levels are the levels that serve as targets when buying or selling the pair. You can place Take Profit near these levels.
Kijun-sen and Senkou Span B lines are lines of the Ichimoku indicator transferred to the hourly timeframe from the 4-hour one.
Support and resistance areas are areas from which the price has repeatedly rebounded off.
Yellow lines are trend lines, trend channels and any other technical patterns.
Indicator 1 on the COT charts is the size of the net position of each category of traders.
Indicator 2 on the COT charts is the size of the net position for the "non-commercial" group.


