


Trend analysis (Fig. 1).
Today, from the level of 1.1805 (the closing of yesterday's daily candle), the market will try to continue moving down with the goal of 1.1798 which is a pullback level of 38.2% (red dotted line). In the case of testing this level, work down to the level of 1.1760 which is a pullback level of 50% (red dotted line). If successful, further work up to 1.1811 historical resistance level (blue dotted line).
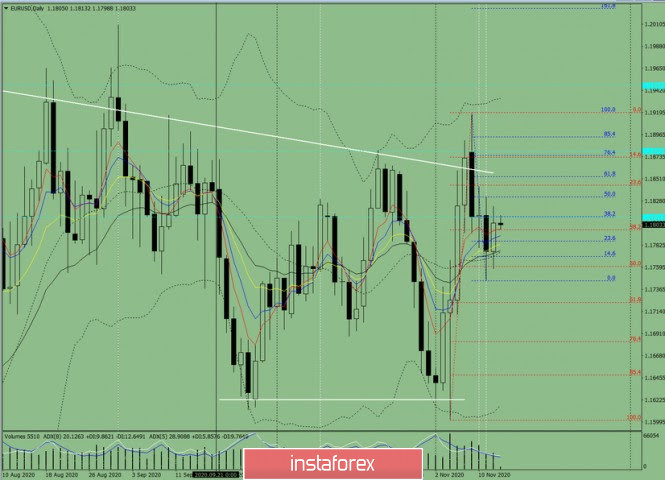
Figure 1 (daily chart).
Complex analysis:
- Indicator Analysis – down
- Fibonacci Levels – down
- Volumes – down
- Technical Analysis – down
- Trend Analysis – down
- Bollinger Bands – down
- Weekly Chart – down
General conclusion:
Today, from the level of 1.1805 (the closing of yesterday's daily candle) the price will try to continue moving down with the goal of 1.1798 which is a pullback level of 38.2% (red dotted line). In the case of testing this level, work down to the level of 1.1760 which is a pullback level of 50% (red dotted line). If successful, further work up to 1.1811 or the historical resistance level (blue dotted line).
Alternative scenario: From the historical resistance level of 1.1811 (blue dotted line), the price may start moving up with the goal of 1.1832 which is a 50% pullback level (blue dotted line). If this line is tested, work up to the level of 1.1853 or a pullback level of 61.8% (blue dotted line).


