


Trend analysis (Fig. 1).
Today, the market will try to start moving upward from the level of 1.3113 (closing of yesterday's daily candlestick) with the goal of 1.3154 - the historical resistance level (blue dotted line). When this level is reached, the price can continue to move down with a target of 1.3066 - a pullback level of 38.2% (red dotted line).
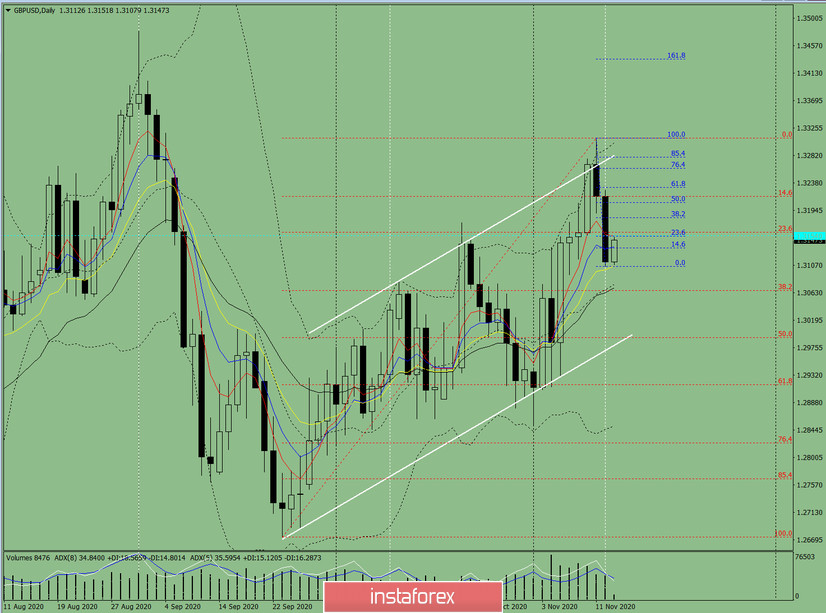
Figure 1 (Daily Chart).
Comprehensive analysis:
- Indicator analysis - down;
- Fibonacci levels - down;
- Volumes - down;
- Candlestick analysis - down;
- Trend analysis - down;
- Bollinger bands - down;
- Weekly chart - down.
General conclusion:
Today, the price from the level of 1.3113 (closing of yesterday's daily candlestick) will try to start moving upward with the goal of 1.3154 - the historical resistance level (blue dotted line). When this level is reached, the price can continue to move down with a target of 1.3066 - a pullback level of 38.2% (red dotted line).
Unlikely scenario: from the level of 1.3154 - the historical resistance level (blue dotted line), the price may continue to move up with the goal of 1.3183 - a pullback level of 38.2% (blue dotted line).


