


Trend analysis (Fig. 1)
Today, from the level of 1.3264 (the closing of yesterday's daily candle) the market can continue to work down with the goal of 1.3117 which is a pullback level of 14.6% (red dotted line). After testing this line, continue working down with the target of 1.3159 which is a pullback level of 23.6% (red dotted line). When this level is reached, it is possible to work up.
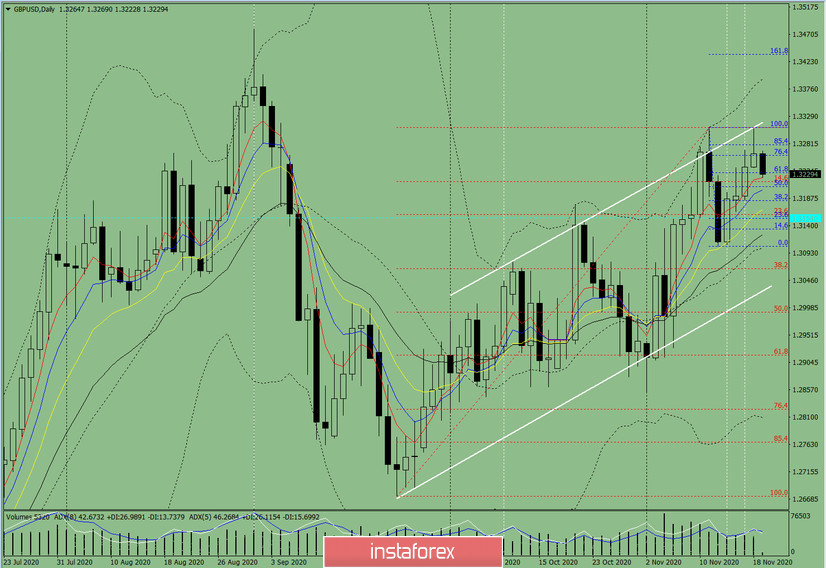
Figure 1 (daily chart).
Complex analysis:
- Indicator Analysis – down
- Fibonacci Levels – down
- Volumes – down
- Technical Analysis – down
- Trend Analysis – down
- Bollinger Bands – up
- Weekly Chart – down
General conclusion:
Today, from the level of 1.3264 (the closing of yesterday's daily candle), the price can continue to work down with the goal of 1.3117 which is a pullback level of 14.6% (red dotted line). After testing this line, continue working down with the target of 1.3159 which is a pullback level of 23.6% (red dotted line). When this level is reached, it is possible to work up.
Alternative scenario: When moving down and reaching the pullback level of 14.6% at 1.3117 (red dotted line), the market will try to move up with the goal of 1.3211 which is the upper fractal (red dotted line).


