To open long positions on EUR/USD, you need:
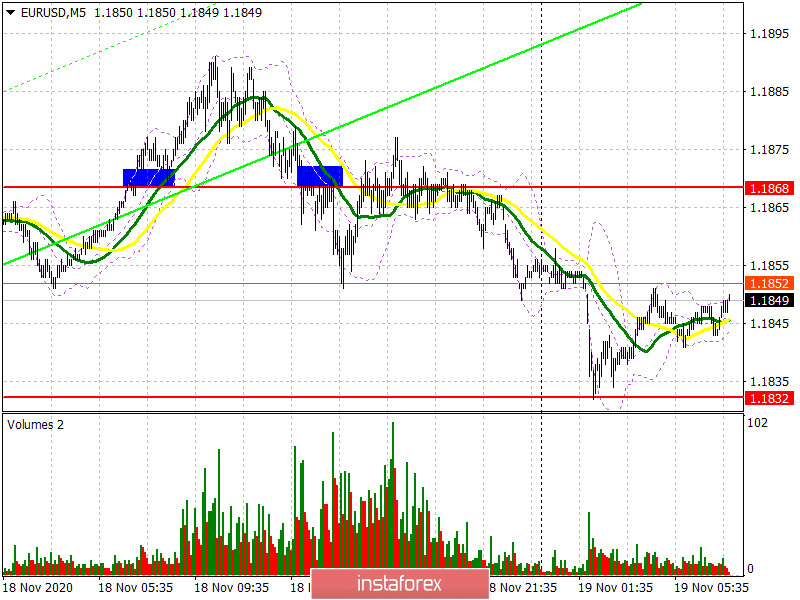
Buyers of the euro made an attempt for a breakout and tried to settle above the resistance of 1.1868 yesterday, which produced a good signal to enter long positions. I marked the entry point on the 5-minute chart. Testing this level from top to bottom worked perfectly, afterwards the euro grew. However, it was not possible to break above the weekly highs, and the eurozone inflation data discouraged traders from being more active. As a result, we could see the euro return to the area under 1.1868, testing it from the bottom up produced a good sell signal, which caused the pair to return to a low of 1.1832.

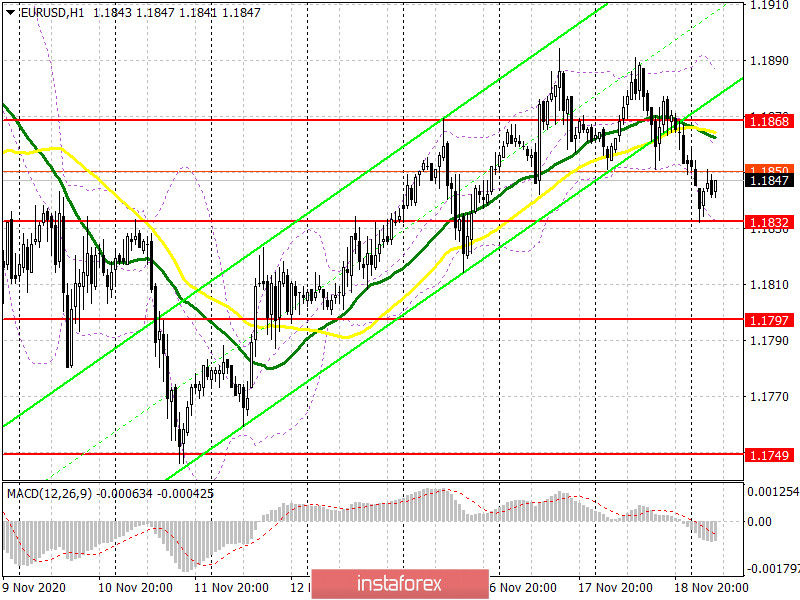
Not much has changed from a technical point of view. Support at 1.1832 has already been tested today, and buyers will focus on this level in the first half of the day. If the euro bulls manage to protect support at 1.1832 once again, then a false breakout there will be a good entry point for long positions in hopes for the pair to reach the resistance area of 1.1868, where the pair might temporarily stop rising. Getting the pair to settle at this level will open a direct road to the next target, which is the monthly high of 1.1915, where I recommend taking profits. In the morning, the focus will be tied to the speech of European Central Bank President Christine Lagarde, since no other important fundamental events are planned. If the bulls are not active in the 1.1832 area, then we might see EUR/USD under this range. In this case, buyers will focus on protecting support at 1.1797. You can open long positions from it but only on the first test, counting on a correction of 15-20 points within the day. A larger reversal in favor of buyers will occur if they manage to form a false breakout at 1.1743.
To open short positions on EUR/USD, you need:
The sellers' initial task is to test the 1.1832 level, which they tested for strength in today's Asian session. Settling below 1.1832 and testing it from the bottom up forms a more convenient entry point to short positions in hopes to bring back the downward trend. In this case, the nearest target will be the low of 1.1797. Testing this level will only be an indication that the pair is stuck in a horizontal channel. A breakdown and consolidation below this range will lead EUR/USD to the area of the lower border of the 1.1749 horizontal channel, where I recommend taking profits. We can only talk about returning the bearish trend after going beyond this area, which will quickly pull down the pair to the 1.1701 low. If the bulls turn out to be stronger and continue to push the pair after the speech of Lagarde and her representatives, then it would be best not to rush to sell, but wait for an update of the larger resistance at 1.1868. However, you can only sell from this position if a false breakout appears there. I recommend opening short positions in EUR/USD immediately on a rebound from the monthly high of 1.1915, counting on a correction of 15-20 points within the day.

The Commitment of Traders (COT) report for November 10 showed a reduction in long and short positions. Euro bulls are holding on to a wait-and-see attitude and are in no hurry to return to the market even after the US presidential elections. Despite this, buyers of risky assets believe that the bull market will continue, although they prefer to proceed with caution. Thus, long non-commercial positions decreased from 208,237 to 202,374, while short non-commercial positions remained practically unchanged, falling from 67,888 to 67,087. The total non-commercial net position decreased to 135,287 against 140,349 a week earlier. It is worth noting that the delta has been declining for seven consecutive weeks, which confirms the buyers' lack of desire to enter the market in the current conditions. Growth will only begin after Joe Biden's victory as he intends to endow the American economy with the next largest monetary aid package worth more than $2 trillion.
Indicator signals:
Moving averages
Trading is carried out just below the 30 and 50 moving averages, which indicates the likelihood of the euro's succeeding decline.
Note: The period and prices of moving averages are considered by the author on the H1 hourly chart and differs from the general definition of classic daily moving averages on the D1 daily chart.
Bollinger Bands
A breakout of the lower border of the indicator around 1.1832 will increase pressure on the euro. A breakout of the upper border of the indicator in the 1.1870 area will lead to a new wave of growth for the pair.
Description of indicators
- Moving average (moving average, determines the current trend by smoothing out volatility and noise). Period 50. It is marked in yellow on the chart.
- Moving average (moving average, determines the current trend by smoothing out volatility and noise). Period 30. It is marked in green on the chart.
- MACD indicator (Moving Average Convergence/Divergence — convergence/divergence of moving averages) Quick EMA period 12. Slow EMA period to 26. SMA period 9
- Bollinger Bands (Bollinger Bands). Period 20
- Non-commercial speculative traders, such as individual traders, hedge funds, and large institutions that use the futures market for speculative purposes and meet certain requirements.
- Long non-commercial positions represent the total long open position of non-commercial traders.
- Short non-commercial positions represent the total short open position of non-commercial traders.
- Total non-commercial net position is the difference between short and long positions of non-commercial traders.


