


Daily
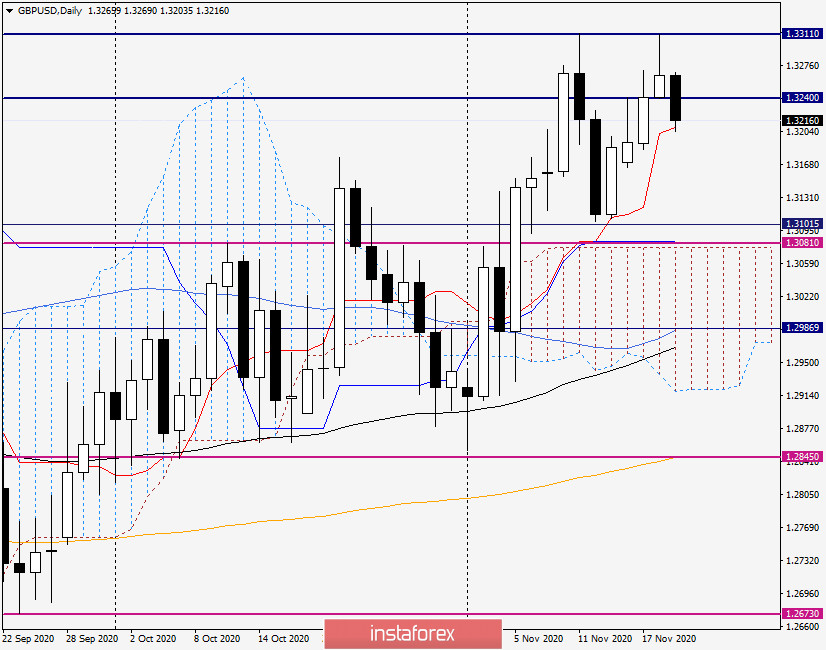
Despite yesterday's strengthening of the British pound against the US dollar, the situation regarding the further direction of the GBP/USD currency pair remains far from clear. The situation is not clear about the conclusion of a trade deal between the UK and the European Union. The British continue to say that they are ready to agree, but the European Union must respect the sovereignty of the UK with due respect. It's an old song.
But yesterday's daily candle with a particularly long upper shadow and the inability to overcome the strong resistance of sellers at 1.3311 is more pessimistic. Most often, after such candles and the second unsuccessful attempt to break through the resistance, a reversal to a decrease in the rate follows. This is exactly what is observed at the moment of writing. The pound/dollar pair is currently trading near 1.3215. The current support is provided by the red Tenkan line of the Ichimoku indicator, but if it is passed and the auction closes lower, it is time to count on a subsequent decline in the quote. In this case, the subsequent targets of the bears for the pound will be 1.3180 and 1.3100. At the same time, a breakdown of the last level will finally convince the sellers to have control over the pair. To reanimate the bullish scenario, it is necessary to break through the resistance of sellers at 1.3311, which has already blocked the way up twice and pushed the pair in the south direction. Given the current picture on the daily timeframe, I am more inclined to assume a downward scenario.
H4
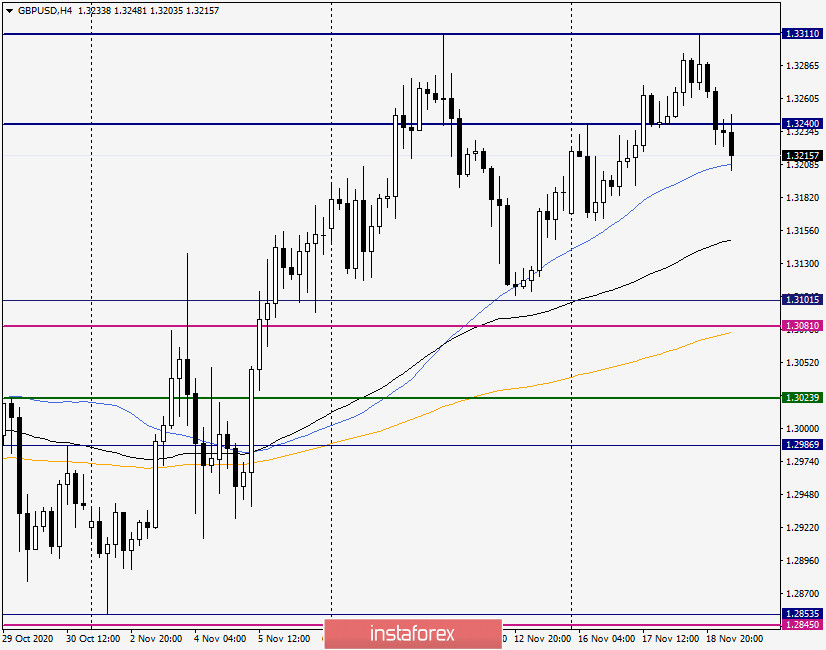
On the four-hour chart, the pair is trading above the used moving averages (50 MA, 89 EMA, and 200 EMA), while at the time of writing, the quote is testing the simple moving average for a break of 50. If the 50 MA breakdown takes place, we expect a further decline to 89 EMA, which is at 1.3148. If this moving average can be pushed, the downward trend will continue to the area of 1.3100-1.3080, where there are a strong technical level and the orange 200 exponentials.
But in case of failure to break through 50 MA and the appearance of a reversal model of candle analysis here, a signal will appear that the pound bulls are ready to once again try to raise the rate to the area of 1.3300. If this happens, it is highly likely that the resistance at 1.3311 will still be broken on the third attempt.
If you go to the trading recommendations, then both purchases and sales can be considered relevant. However, given yesterday's daily candle, the GBP/USD pair's sales look more typical. I suggest that we consider the nearest options for opening short positions after short-term rises to the levels of 1.3233 and 1.3255 and the appearance of bearish candle patterns here. I suggest you take a closer look at the purchases after the price drops to the price zone of 1.3200-1.3180. In this case, bullish candlestick signals will be the confirmation for opening long positions. From today's statistics, the price dynamics of the GBP/USD pair may be affected by initial applications for unemployment benefits and the Philadelphia Federal Reserve's manufacturing index, which will be published at 14:30 London time.


