


EUR/USD - 24H.
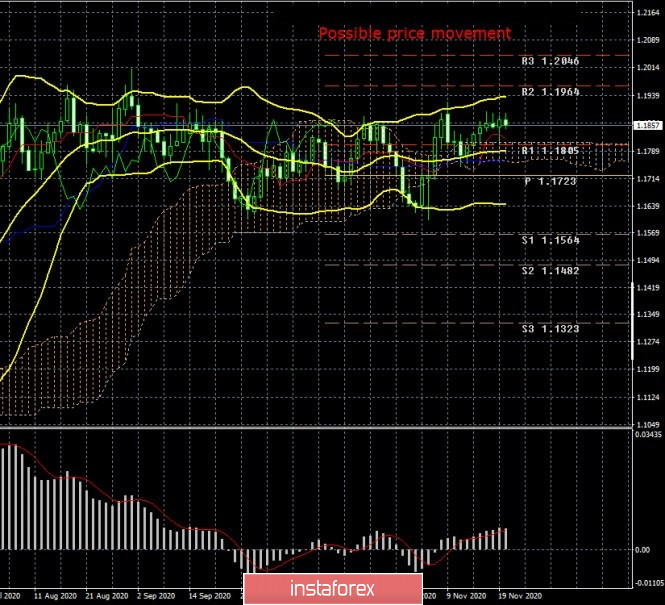
Over the past week, the EUR/USD pair has grown by 15 points. Moreover, it was not a movement from the category of 200 points up to 185 points down. No, the volatility of the euro/dollar pair was minimal throughout the week, 40-50 points daily. Thus, there were no changes in the technical picture. The pair remains inside the side channel of 1.1700-1.1900 and nothing has changed for three months, if not more. Several times during this time, the price still left the channel, but for an extremely short time. Thus, the trading strategy remains the same. Traders can either trade between the borders of the channel, or wait for the completion of this outright flat and only then resume trading. In general, the Ichimoku indicator continues to generate false signals, since it always does so in the flat. Well, the Bollinger bands continue to be directed sideways.
The COT report.
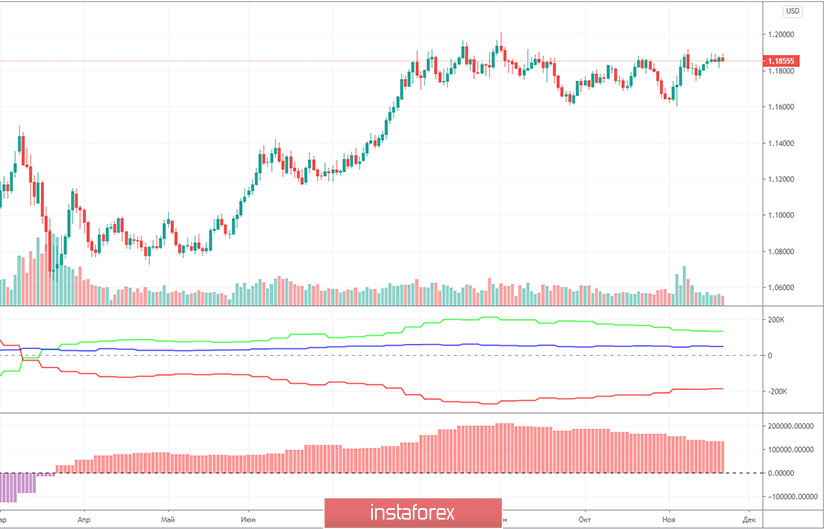
During the last reporting week (November 10-16), the EUR/USD pair increased by 40 points. As you can see, the price changes are still minimal. There were some bursts of activity during the US presidential election, however, they ended very quickly and now the pair is not just continuing to trade in a side channel, but also with minimal volatility. Thus, we expect COT reports to explain the current situation. Unfortunately, COT reports have been showing that non-profit traders are reducing their net position for 8-10 weeks. This means that their mood becomes more bearish. The green and red lines of the first indicator show the net positions of commercial and non-commercial traders, and when they move far away from each other, this is considered a strong signal for a trend change. However, the lines have moved away and now they have been moving towards each other for two months. And the downward trend doesn't start yet. During the reporting week, the group of traders "Non-commercial", which is the most important and significant, opened 2 thousand contracts for the purchase and 1.5 thousand contracts for the sale of the euro currency. Thus, there is simply no change in the mood of this group of traders. We are much less interested in other groups of traders. In general, we have a somewhat paradoxical situation when professional traders have been reducing the number of purchases of the euro currency and increasing sales for more than two months, but the euro has not fallen. However, based on the reported data, we still believe that the peak of the entire upward trend was formed near the level of 1.2000, and sooner or later the downward movement will resume.
What can we say about the fundamental background of the past trading week? It was strong enough. There are still a lot of topics that could potentially interest investors, however, it is still unclear what exactly market participants are paying attention to? "Coronavirus" has been raging in the United States and the EU. The US election is over, however, Donald Trump continues to try through the courts to challenge the results of the voting. In the European Union, Poland and Hungary have blocked the seven-year budget and fund economic recovery after the pandemic. This is a summary of the news. "Coronavirus" has long been not perceived by market participants as an important factor for a particular currency. Indeed, it is better to wait for specific changes in the economy itself and rely on them when making trade decisions. However, all macroeconomic statistics continue to be ignored. Moreover, statistics are beginning to deteriorate again in both America and the European Union. For example, inflation in the EU remains negative, while in the US it slows down. The new "lockdown" in Europe is almost guaranteed to affect the European economy and its GDP. There is no lockdown in the United States, however, many states are also tightening quarantine measures. Plus, there is a "Trump factor" in America, which has been thinking only about re-election for months instead of running the country. In general, there are a lot of news and important topics, however, traders are waiting for something more important. Otherwise, nothing can explain the three-month flat for the euro/dollar pair.
Trading plan for the week of November 23-27:
1) The pair's quotes continue to trade in the side channel. The resumption of the upward trend can be discussed no earlier than overcoming the previous local maximum near the level of 1.2000 or at least overcoming the upper line of the side channel of 1.1900. Until then, it is recommended to continue trading inside the side channel using lower timeframes.
2) To be able to sell the EUR/USD pair, you need to at least wait for the price to consolidate below the Kijun-sen and Senkou Span B lines. However, even in this case, the potential for a downward movement is limited to the 1.1700 level or the lower Bollinger band. On lower timeframes, you can look for short-term trends, but keep in mind that in the most long-term plan, it is the flat that remains.
Explanation of the illustrations:
Price levels of support and resistance (resistance/support) – target levels when opening purchases or sales. You can place Take Profit levels near them.
Ichimoku indicators, Bollinger bands, MACD.
Support and resistance areas – areas that the price has repeatedly bounced from before.
Indicator 1 on the COT charts – shows the net position size of each category of traders.
Indicator 2 on the COT charts – the net position size for the "Non-commercial" group.


