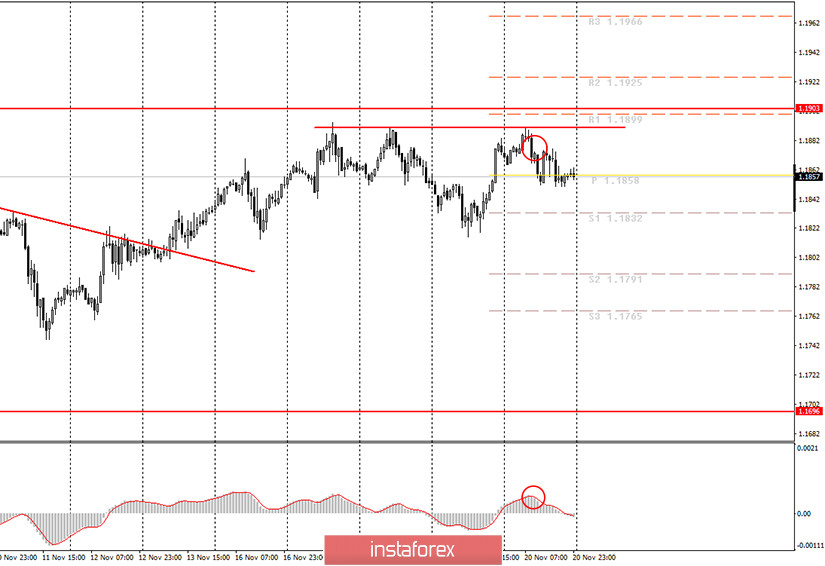
The hourly chart of the EUR/USD pair.

The EUR/USD currency pair turned up quite unexpectedly on Friday and started a new round of correction against the beginning of the downward trend. Although the definitions of "trends" and "corrections" are now quite formal. The problem is that the euro/dollar pair continues to trade inside the side channel of 1.1700-1.1900. Thus, any trend is just a trend inside this side channel. Moreover, the trend is usually supported by a trend line or a trend channel. In our case, we often determine the trend by the price reversal near the upper or lower border of the channel. Thus, it is not surprising that from time to time there are such movements that are not quite logical, from the point of view of technical analysis. It is good that the MACD has smoothed out almost all corrections within the day. First, the indicator turned up, and since we recommended trading lower on Friday, novice traders did not lose anything, then down (marked with a circle) - and then traders could open short positions. However, the drop in quotes was short-lived and the maximum that traders could earn was 20 points. On the other hand, all last week the volatility was very low, and in such conditions, 20 points of profit are not bad.
During the last trading day of the week, ECB President Christine Lagarde made another speech in the European Union, which again did not tell the markets anything interesting or important. During the past week, the head of the ECB spoke almost every day, but none of her speeches provoked any reaction from the markets. Lagarde talked about the vaccine, the "coronavirus", the deteriorating prospects for the European economy, the digital euro, however, nothing that could be regarded as really important information. Thus, very low volatility is an eloquent reflection of traders' interest in Lagarde's speeches and any other macroeconomic events in the past week. There was something interesting, something didn't matter that it was ignored.
On Monday, the European Union is scheduled to publish business activity indices in the service and manufacturing sectors. Similar figures will be released in the US. Given the fact that lockdown was already introduced in many European countries in November, it is absolutely clear that business activity will fall. In the service sector - exactly, in the production sector - in doubt. Forecasts say exactly this. The service sector should fall very seriously to 42.5 points, while the production sector is likely to stay above 50.0. In America, the picture is the opposite. There is no lockdown, so there is no drop in business activity either. Thus, tomorrow the euro currency may be under restrained market pressure and resume falling.
On November 23, the following scenarios are possible:
1) Long positions are currently not relevant. It will now be possible to return to purchases of the Euro currency no earlier than the end of the current downward trend. In the current conditions, the only option is to overcome the level of 1.1903, which will mean the pair's exit from the side channel of 1.1700-1.1900. In this case, it is recommended to open long positions with targets of 1.1925 and 1.1966.
2) Trading on the downside is currently relevant, as the trend has changed to a downward one. The next round of upward correction has ended, so now novice traders can stay in the pair's sales with targets of 1.1832 and 1.1791. Given the minimal volatility, we do not expect strong movements on Monday. Reversal of the MACD indicator up-reduce sales orders.
What's on the chart:
Price support and resistance levels – target levels when opening purchases or sales. You can place Take Profit levels near them.
Red lines – channels or trend lines that display the current trend and indicate which direction is preferable to trade now.
Up/down arrows- – show when you reach or overcome which obstacles you should trade up or down.
MACD indicator(14,22,3) – a histogram and a signal line, the intersection of which is a signal to enter the market. It is recommended to use it in combination with trend lines (channels, trend lines).
Important speeches and reports (always included in the news calendar) can greatly influence the movement of the currency pair. Therefore, during their exit, it is recommended to trade as carefully as possible or exit the market in order to avoid a sharp reversal of the price against the previous movement.
Beginners in the Forex market should remember that every trade cannot be profitable. The development of a clear strategy and money management is the key to success in trading over a long period of time.


