


Trend analysis (Fig. 1).
Today, the market may continue to move upward from the level of 1.3280 (closing of last Friday's daily candlestick) with the target of 1.3322 - the resistance line (white bold line). When testing this line, upward movement should be continued with the goal of 1.3436 – the target level of 161.8% (blue dotted line).
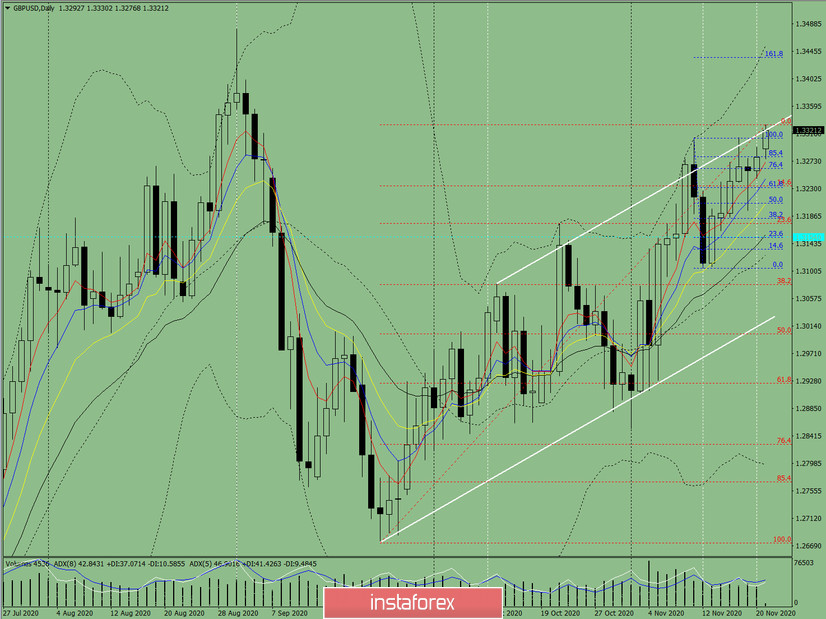
Figure 1 (Daily chart).
Comprehensive analysis:
- Indicator analysis - up;
- Fibonacci levels - up;
- Volumes - up;
- Candlestick analysis - down;
- Trend analysis - up;
- Bollinger bands - up;
- Weekly chart - up.
General conclusion:
Today, the price may continue to move upward with the target of 1.3322 - the resistance line (white bold line). When testing this line, upward movement should be continued with the goal of 1.3436 – the target level of 161.8% (blue dotted line).
Alternative scenario: from the level of 1.3280 (closing of last Friday's daily candlestick), the price may continue to move up with the target of 1.3322 - the resistance line (white bold line). When testing this line, work downward with the goal of 1.3234 - a 14.6% pullback level (red dotted line).


