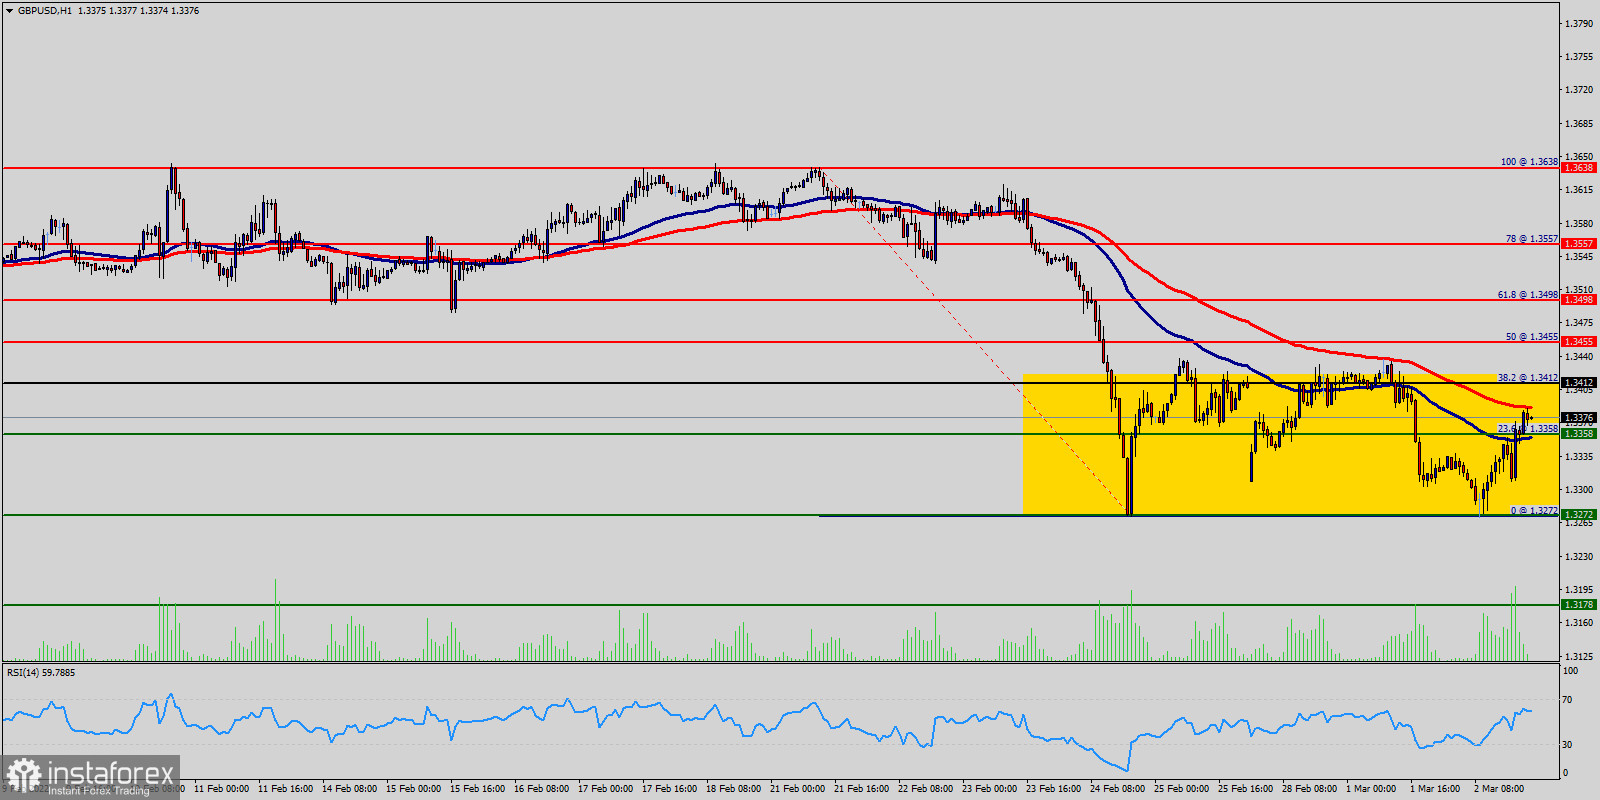
The GBP/USD pair has been trading in a tight sideways range since last week and the price has also set below the weekly resistance 1 at the level of 1.3412.
Moreover, the price has already formed double bottom at the 1.3272 level. Accordingly, the market will move between 38.2% of Fibonacci retracement levels (1.3412) and 00% of Fibonacci retracement at the price of 1.3272.
In particular, it should noted that at the level of 1.3272 which represents the support, we can expect explosive breakout and it is likely that the market is going to start showing the signs of bullish market.
In other words, it will be a good sign to buy above double bottom at the level of 1.3272 with a first target at 1.3412 in order to test the weekly pivot point and it will climb towards 1.371.345528.
However, if the the price of the GBP/USD pair breaks 1.3272 and closes below it, the market will indicate a bearish opportunity below 1.3272 then the best location to set stop loss should be at the 1.3178 price.


