To open long positions on GBP/USD, you need:
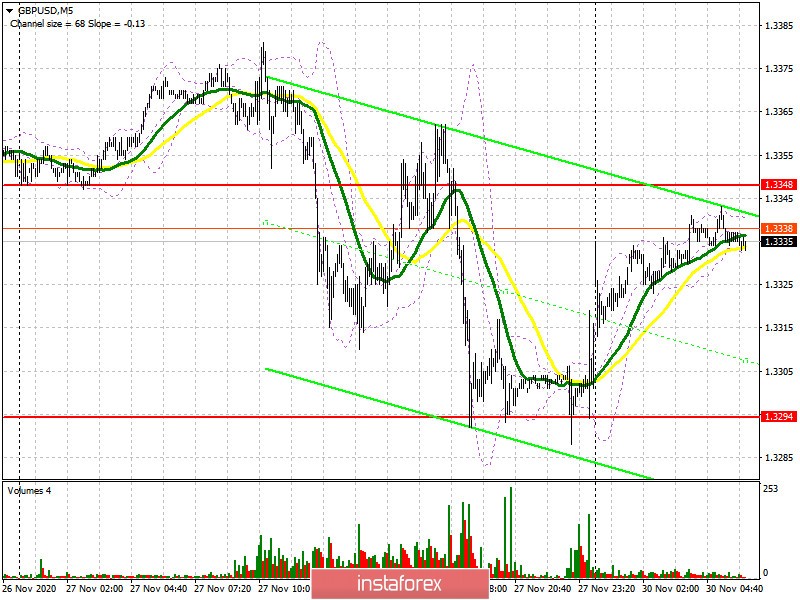
Last Friday we saw an excellent way to sell the British pound after breaking support at 1.3348. If you look at the chart, you will see how the bears achieved a real breakout of the 1.3348 level and even if you did not have time to enter short positions from it after the first breakout, the correction and this level being tested from the bottom up (as it should be) resulted in producing an excellent entry point to sell, which formed another wave of GBP/USD decline towards the end of the day and also brought traders around 50 points in profit.

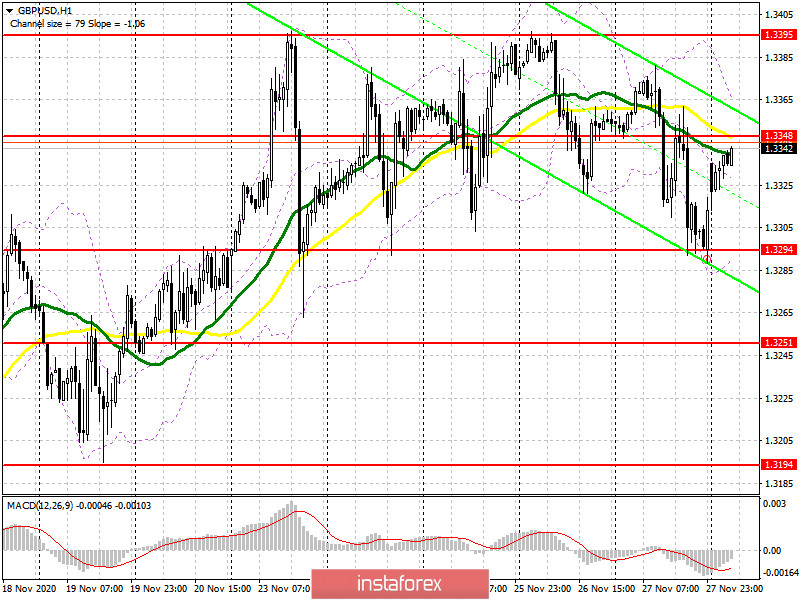
We are unlikely to be pleased with any news regarding Brexit at the beginning of the week, although there were rumors at the end of last week that negotiators might meet over the weekend in London. Given the intensity of the talks and the fact that the dates are coming to an end, the pound is expected to be quite volatile. Bulls need to regain resistance at 1.3348, getting the pair to settle at this level and testing it from top to bottom produces a fairly good signal for buying GBP/USD in order for it to rise to the 1.3395 area, which also acts as the upper border of the horizontal channel and is also where the pound stayed for the entirety of last week. A breakout and being able to settle above this range, along with good news on Brexit, will lead to a new wave of growth in the pound towards highs of 1.3453 and 1.3509, where I recommend taking profits. In case the pound falls in the first half of the day, the bulls will try to protect support at 1.3294 again, but there is little hope for this level. Forming a false breakout there provides a signal to open long positions. If it is not active in this range, it is best to postpone buy positions until a new low near 1.3294 has been updated, or buy GBP/USD immediately after rebounding from the 1.3194 low, counting on an upward correction of 20-30 points within the day.
To open short positions on GBP/USD, you need:
Pound sellers need to defend resistance at 1.3348. Forming a false breakout on it will be the first signal to continue the downward momentum that appeared at the end of last week. A smooth reversal of the pound since November 24 also indicates the fact that bears are weighing on the pair each time, preventing it from updating local highs, which indicates their advantage over buyers. In case of a false breakout at 1.3348, the initial goal is to return support at 1.3294, settling below it will lead to a fairly quick sell-off of GBP/USD in the area of the 1.3251 low, while the bears' next target will be support at 1.3194. In case bears are not active in the middle of the 1.3348 channel, it is best to postpone selling until the test of its upper border at 1.3395. However, the next update of this level will be very dangerous for the current downward trend, therefore, you can only sell from there on the first test, immediately for a rebound, counting on a correction of 20-25 points within the day. Larger sales can be made only after the 1.3453 high has been updated.

The Commitment of Traders (COT) reports for November 17 saw a reduction in long positions and a sharp inflow of short positions. Long non-commercial positions declined from 27,872 to 27,454. At the same time, short non-commercial positions increased from 45,567 to 47,200. As a result, the negative non-commercial net position was -19,746 against -17,695 a week earlier, which indicates that the sellers of the British pound retains control and also shows their slight advantage in the current situation. Lack of clarity on the trade deal, together with the lockdown of the British economy in November, clearly does not add optimism and confidence to buyers of the pound.
Indicator signals:
Moving averages
Trading is carried out in the area of 30 and 50 moving averages, which indicates uncertainty regarding the pound's succeeding direction.
Note: The period and prices of moving averages are considered by the author on the H1 hourly chart and differs from the general definition of the classic daily moving averages on the daily D1 chart.
Bollinger Bands
A breakout of the upper border of the indicator around 1.3355 will lead to a new wave of growth for the pound. A breakout of the lower border of the indicator in the 1.3294 area will increase the pressure on the pair.
Description of indicators
- Moving average (moving average, determines the current trend by smoothing out volatility and noise). Period 50. It is marked in yellow on the chart.
- Moving average (moving average, determines the current trend by smoothing out volatility and noise). Period 30. It is marked in green on the chart.
- MACD indicator (Moving Average Convergence/Divergence — convergence/divergence of moving averages) Quick EMA period 12. Slow EMA period to 26. SMA period 9
- Bollinger Bands (Bollinger Bands). Period 20
- Non-commercial speculative traders, such as individual traders, hedge funds, and large institutions that use the futures market for speculative purposes and meet certain requirements.
- Long non-commercial positions represent the total long open position of non-commercial traders.
- Non-commercial short positions represent the total short open position of non-commercial traders.
- Total non-commercial net position is the difference between short and long positions of non-commercial traders.


