


On Friday, the pair continued to trade downward from the resistance level (red bold line), testing the pullback level of 14.6% (blue dotted line). Today, the price may begin to move up. As per the economic calendar, dollar news is expected at 15:00 UTC.
Trend analysis (Fig. 1).
The market may move upward from the level of 1.3313 (closing of Friday's daily candlestick) with the target at the resistance level 1.3394 (black bold line). Upon testing this level, the upward trend may continue with the next target at the upper fractal 1.3481 (daily candle from 01/09/2020) red dotted line.
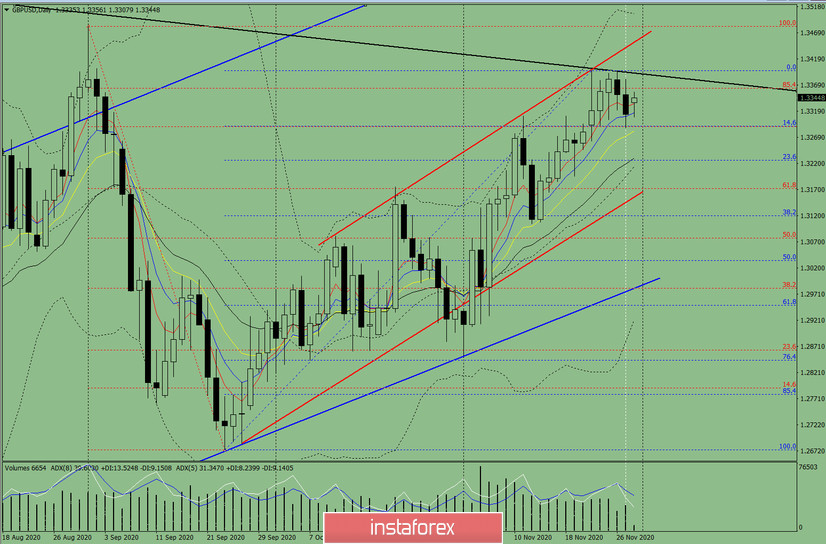
Figure: 1 (daily chart).
Comprehensive analysis:
- Indicator analysis - up;
- Fibonacci levels - up;
- Volumes - up;
- Candlestick analysis - down;
- Trend analysis - up;
- Bollinger lines - up;
- Weekly chart - up.
General conclusion:
Today, the price may continue to move upward with the target at the resistance level 1.3394 (black thick line). Upon testing this level, the upward trend may continue with the next target at the upper fractal 1.3481 (daily candle from 09/01/2020) presented in a red dotted line.
Another possible scenario: from the level of 1.3313 (closing of Friday's daily candlestick), the price may continue to move down with the target at 1.3226 - a 23.6% pullback level (blue dashed line). The upward trend may continue upon testing this level.


