Pair : GBP/USD :
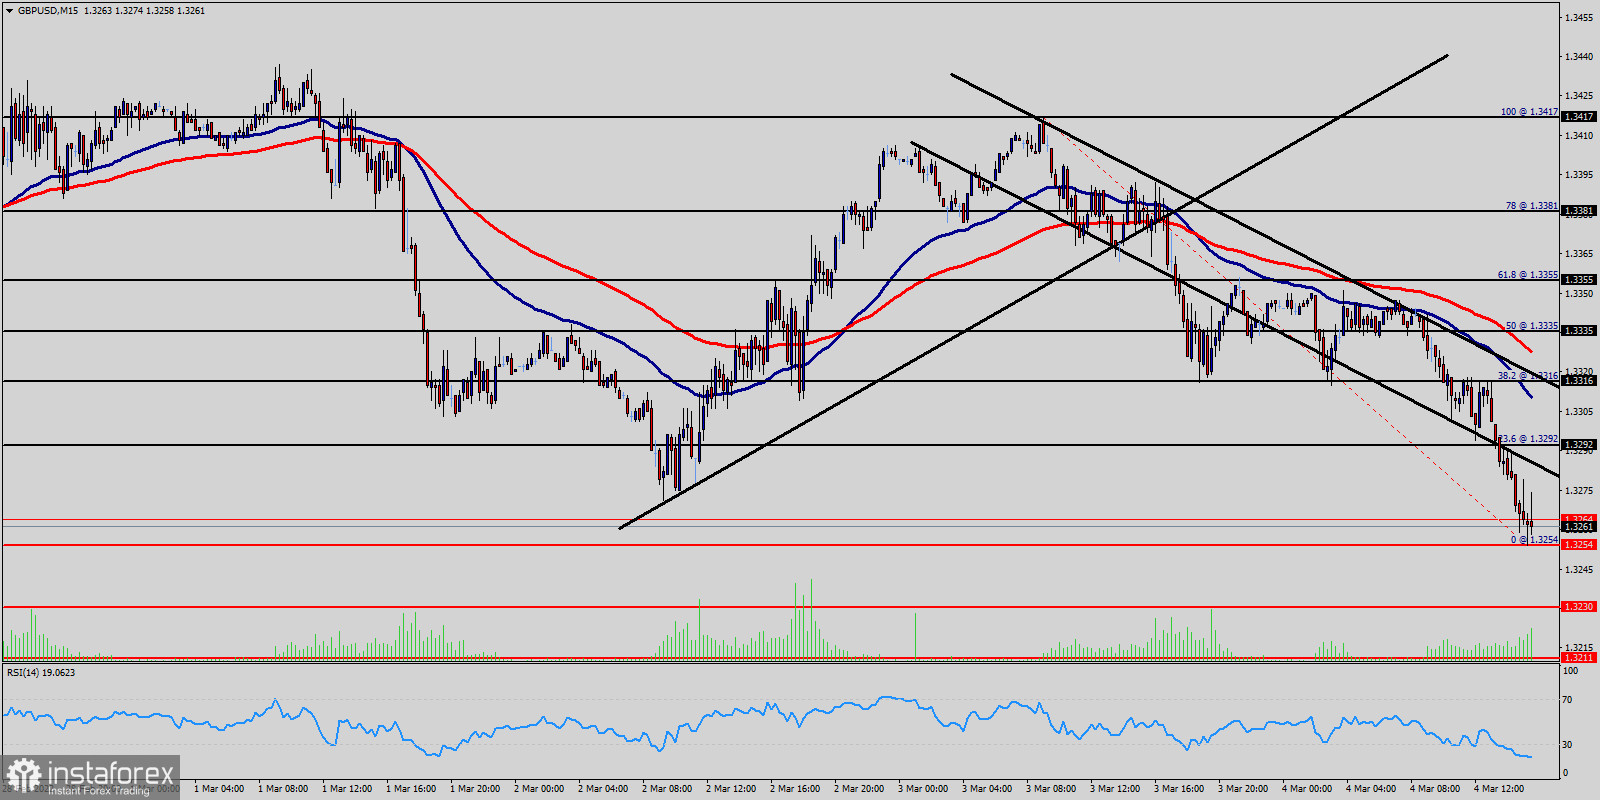
The past 4 days had been a blast for US dollar against pound, after dropping to the bottom of the trading range between 1.3292 and 1.3254.
The Relative Strength Index (RSI) is considered oversold because it is below 30. There is an apparent divergence between the price and the RSI on the 15M time frame. Additionally, the RSI is still calling for a strong bearish market as well as the current price is also below the moving average 100 and 50.
The GBP/USD pair has broken support at the level of 1.3292 which acts as resistance now. Thus, the pair has already formed minor resistance at 1.3292.The strong resistance is seen at the level of 1.3316 because it represents the weekly support 1.
However, if the pair fails to pass through the level of 1.3292, the market will indicate a bearish opportunity below the new strong resistance level of 1.3292 (the level of 1.3292 coincides with a ratio of 23.6.8% Fibonacci).
Thus, the market is indicating a bearish opportunity below 1.3292 so it will be good to sell at 1.3292 or/and 1.3255 with the first target of 1.3230.
It will also call for a downtrend in order to continue towards 1.3211. The daily strong support is seen at 1.3211.
The GBP/USD pair breaks through the support level of 1.3211, a further decline to 1.3150 can occur which would indicate a bearish market.
We don't think that the trend will know a reversal today, in overall, we still prefer the bearish scenario.


