


Trend analysis (Fig. 1).
Today, the market will try to start going down from the level of 1.3414 (closing of yesterday's daily candle) in order to reach the retracement level of 14.6% at 1.3327 (blue dotted line). If this level will be tested, there will be a work going up with the target of 1.3451 at the resistance line (red bold line).
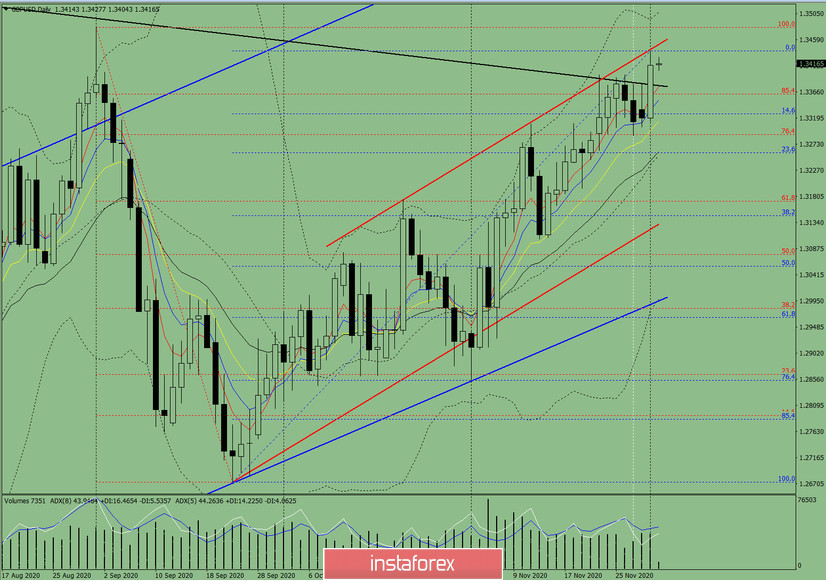
Figure 1 (daily chart).
Complex Analysis:
- Indicator Analysis - down
- Fibonacci Levels - down
- Volumes - down
- Candle Analysis - up
- Trend Analysis - down
- Bollinger Bands - up
- Weekly Chart - up
General Conclusion:
Today, the price will try to start going down from the level of 1.3414 (closing of yesterday's daily candle) in order to reach the retracement level of 14.6% at 1.3327 (blue dotted line). If this level will be tested, there will be a work going up with the target of 1.3451 at the resistance line (red bold line).
Alternative scenario: the price will try to continue going up from the level of 1.3414 (closing of yesterday's daily candle) in order to reach the resistance line of 1.3451 (red bold line). If this line will be tested, the upper fractal (red dotted line) will continue to go up with the target of 1.3481.


