To open long positions on EUR/USD, you need:
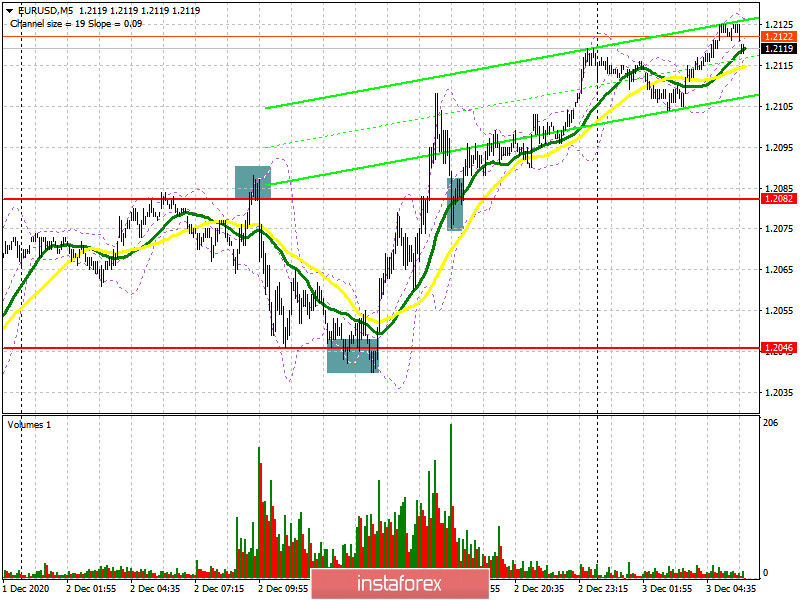
In yesterday's forecast, I drew attention to short deals after a false breakout in the resistance area of 1.2082, which happened. If you look at the 5-minute chart, you will see how buyers failed to settle above 1.2082, forming a false break there, which became a signal to open short positions. The euro sellers reached their target in the 1.2046 area, and the downward movement was about 40 points. Then we had a false breakout from the 1.2046 level, from where I advised you to open long positions. The euro's growth along the trend during the US session led to a breakout of 1.2082, and testing this level from top to bottom once again produced a good entry point for long positions, afterwards the market continued to rise to the 1.2135 area.

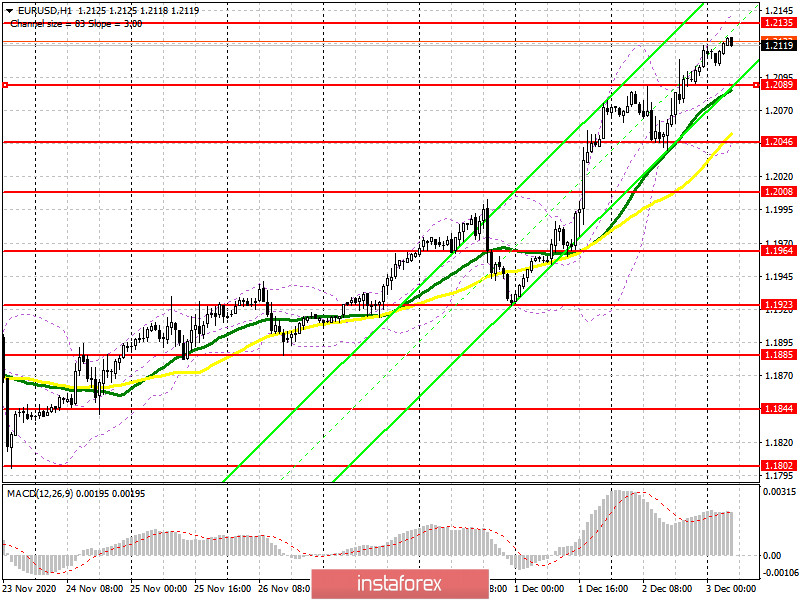
Euro buyers are currently in control of the market. Yesterday's fundamental statistics for the euro area were surprisingly much better than expected. I was pleased with the report on the eurozone labor market, as well as strong growth in retail sales in Germany. At the moment, bulls must break through and settle above the resistance of 1.2135. Testing this level from top to bottom (similar to yesterday's purchase from a high) will be another signal to open long positions in sustaining the bull market with the main goal of updating the high of 1.2194, where I recommend taking profits. The long-term target of the bulls at the end of the week will be the resistance of 1.2255.
Today, we expect quite important reports on the services sector of the eurozone, which is paralyzed due to partial lockdown and quarantine measures in force on the territory. If the eurozone data disappoints the market today, then we can expect a downward correction to the support area of 1.2089. Similar to yesterday's purchase from the 1.2046 level, today you can try to open long positions in the 1.2089 area immediately on the rebound, but it would be better to form a false breakout to sustain the upward trend. The lack of bullish activity in the 1.2089 area may push the euro back to the support of 1.2046, from which you can definitely buy EUR/USD immediately for a rebound, counting on a correction of 15-20 points within the day. There are also moving averages that play on the side of buyers. But before buying the euro at highs, pay attention to the divergence that is on the MACD indicator. This indicates that the market is overbought and a downward turn, against the background of profit-taking, can occur at any time.
To open short positions on EUR/USD, you need:
Yesterday, the bears failed to hold the bullish momentum that was observed in the afternoon. For today, their initial task will be to stop the upward trend, which will happen only if resistance at 1.2135 is protected. Forming a false breakout there will be a signal to open short positions while aiming for a downward correction to the area of the first intermediate support of 1.2089, for which an active struggle will begin. Getting the pair to settle below this level and testing it from the bottom up will be a good sell signal with EUR/USD returning to a large low of 1.2046, where I recommend taking profits. The bears' long-term target will be the 1.2008 support area, testing it will be a wake-up call for euro buyers. However, while the US dollar is under pressure due to weak fundamental statistics and regular programs to stimulate the American economy, it is best to take your time with short deals. A break of 1.2135 will lead to a new wave of euro growth. In this case, you can count on short positions for a rebound after the resistance test of 1.2194, or sell EUR/USD from the new high in the 1.2255 area, counting on a downward correction of 15-20 points within the day. It is best to take your time with short deals while the market is bullish.

The Commitment of Traders (COT) report for November 24 showed an increase in long positions and a decrease in short positions. Buyers of risky assets believe that the bull market will continue and also see a breakout of the psychological mark in the area of the 20th figure, which was tested already on November 30. Long non-commercial positions increased from 203,551 to 206,354, while short non-commercial positions decreased from 69,591 to 68,104. The total non-commercial net position rose to 138,250, against 133,960 a week earlier. Take note of the delta's growth after its 8-week decline, which indicates a clear advantage of buyers and a possible resumption of the medium-term upward trend for the euro. We can only talk about an even bigger recovery when European leaders have negotiated a new trade deal with Britain. Otherwise, you will have to wait until restrictive measures that were introduced due to the second wave of coronavirus in many EU countries have finally been lifted and count on the fact that the ECB will not introduce negative interest rates already at the December meeting.
Indicator signals:
Moving averages
Trading is carried out above 30 and 50 moving averages, which indicates the euro's growth in the short term.
Note: The period and prices of moving averages are considered by the author on the H1 hourly chart and differs from the general definition of the classic daily moving averages on the D1 daily chart.
Bollinger Bands
A breakout of the upper border of the indicator in the 1.2135 area will lead to a new wave of euro growth. In case the pair falls, support will be provided by the lower border of the indicator in the 1.2046 area.
Description of indicators
- Moving average (moving average, determines the current trend by smoothing out volatility and noise). Period 50. It is marked in yellow on the chart.
- Moving average (moving average, determines the current trend by smoothing out volatility and noise). Period 30. It is marked in green on the chart.
- MACD indicator (Moving Average Convergence/Divergence — convergence/divergence of moving averages) Quick EMA period 12. Slow EMA period to 26. SMA period 9
- Bollinger Bands (Bollinger Bands). Period 20
- Non-commercial speculative traders, such as individual traders, hedge funds, and large institutions that use the futures market for speculative purposes and meet certain requirements.
- Long non-commercial positions represent the total long open position of non-commercial traders.
- Short non-commercial positions represent the total short open position of non-commercial traders.
- Total non-commercial net position is the difference between short and long positions of non-commercial traders.


