EUR/USD 15M

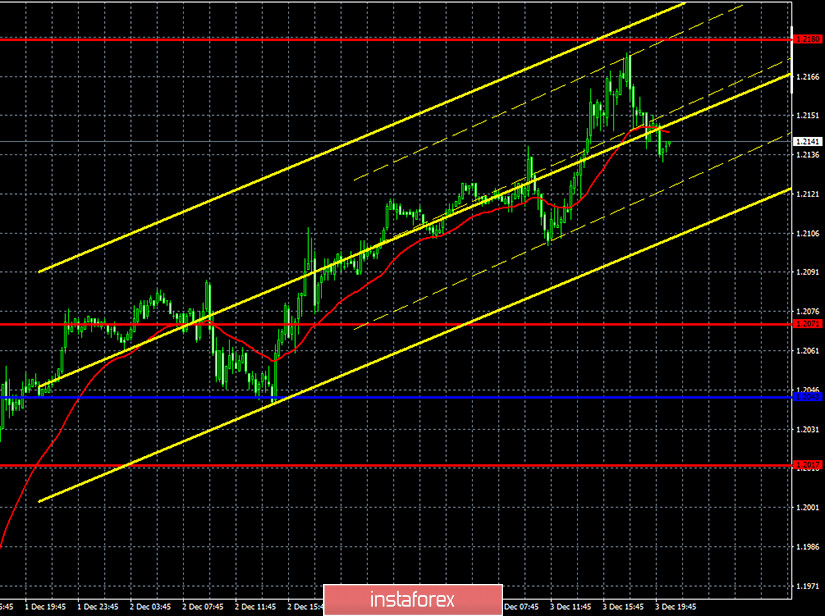
The linear regression channels are directed to the upside on the 15-minute timeframe, which is not surprising, since the upward movement is still present despite all of the fundamental factors. If buyers manage to overcome the 1.2071 level, then growth may persist in the coming days.
EUR/USD 1H

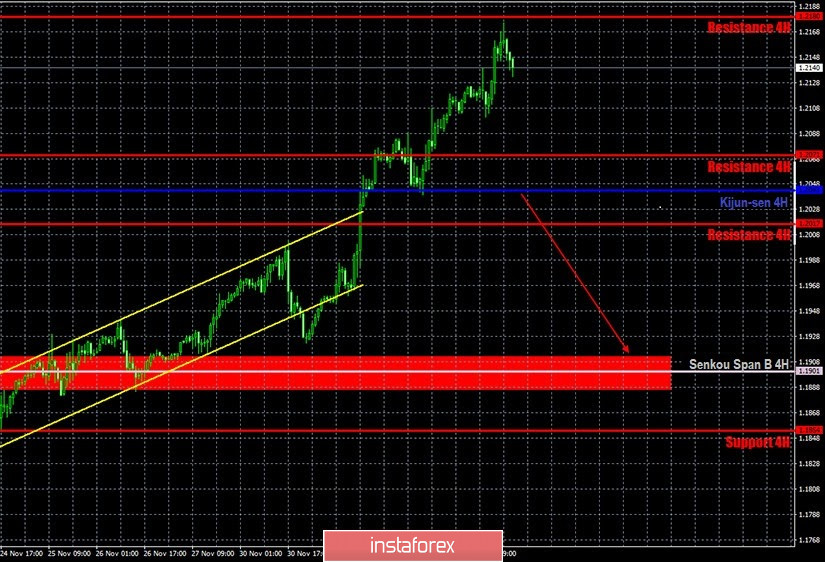
The EUR/USD pair continued to move up on the hourly timeframe on Thursday, December 3. The resistance level of 1.2180, which seemed like a very distant target at the beginning of the week, has practically been reached. There were no hints of a downward correction during the past day. Therefore, the strongest upward movement continues. Its strength can be judged from the rising channel, which the price left several days ago. The angle of the current movement is much stronger. So now it doesn't even make much sense to try to form a new trendline or channel. Anyway, almost any correction or pullback will lead to the fact that quotes will overcome this. Therefore, the euro will continue to increase. It is very difficult to say when this will last. You are advised to trade for a rise. Selling would be suicidal in such a strong upward trend, although current levels may seem very attractive to short.
COT report

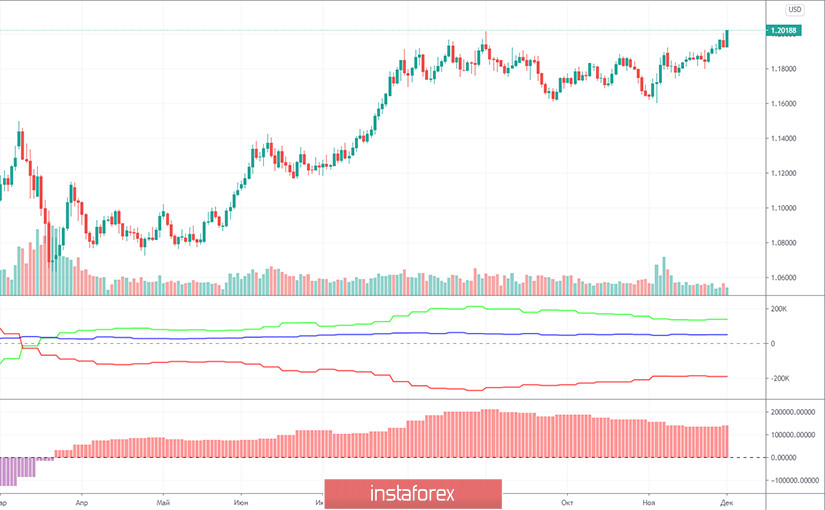
The EUR/USD pair fell by 10 points in the last reporting week (November 17-23). That is, the price changes were again minimal. This indicates a low activity from traders, primarily large traders, whose deals are displayed in the Commitment of Traders (COT) reports. What did the new report show us? Very little. As in the previous week, professional traders opened a small number of new contracts during the week, only about 3,700. Considering that the total number of contracts for the "non-commercial" group is more than 300,000, this means that 3,700 is only about 1%.
However, this time, despite the absence of price changes, professional traders became more bullish. Moreover, for 5,000 contracts at once. This is how the net position changed for the group of non-commercial traders, because in addition to the 3,000 Buy-contracts (longs) that are open, there were also 2,000 Sell-contracts (shorts) that were closed. So, quite unexpectedly, non-commercial traders began to increase their purchases of the euro after at least two months of their reduction. Don't jump to conclusions. So far, it's only been a week. Although, as we can see, according to the subsequent trades, the euro has significantly grown in price. The green and red lines began to diverge again on the first indicator. The second indicator started to show growth. Therefore, based on the latest COT report, we can conclude that the upward trend is resuming. However, we still advise you to be prepared for a possible new downward reversal.
The European Union published an index of business activity in the services sector, which quite predictably remained below 50.0, at 41.7. Of course, these are not the values that we observed in the spring, but they are also very low. This value indicates that the service sector is experiencing problems, which means that the entire EU economy may contract in the fourth quarter. The report on retail sales in the European Union was more optimistic. In October, an increase of 4.3% y/y was recorded against the forecast of + 2.7% y/y. Thus, the European statistics were neither unequivocally positive nor negative. And given all the potential problems of the European Union with the adoption of a seven-year budget and a recovery fund, we would say that it would be more logical for quotes to fall. But no, it still grows.
No important publications or events scheduled for the fifth trading day of the week in the European Union. However, traders do not need them now. Market participants simply carry out massive purchases of the euro at the expense of dollar sales, not paying attention to foundation or macroeconomics. Therefore, today's fundamental background does not matter at all. Traders often like to take profits on open trades on Fridays, which leads to a correction against the main movement. Therefore, it is possible that a downward pullback will begin today. However, it will clearly not be for opening short positions on the EUR/USD pair.
We have two trading ideas for December 4:
1) Buyers continue to move up. Therefore, you are advised to continue trading upward while aiming for the resistance level of 1.2180 (the last resistance level for this week). However, there are few guidelines for maintaining the upward trend. The pair managed to leave the rising channel, so you can only start from the position of the Kijun-sen line (1.2043). But the price will not correct exactly to this line every time, which complicates the process of opening new longs.
2) Bears are releasing the pair from their hands more and more every day, nevertheless, the current fundamental background allows them to count on a downward reversal in the near future. Thus, you are advised to open sell orders while aiming for the Senkou Span B line (1.1901) if the price settles below the Kijun-sen line (1.2043). Take Profit in this case can be up to 120 points.
Forecast and trading signals for GBP/USD
Explanations for illustrations:
Support and Resistance Levels are the levels that serve as targets when buying or selling the pair. You can place Take Profit near these levels.
Kijun-sen and Senkou Span B lines are lines of the Ichimoku indicator transferred to the hourly timeframe from the 4-hour one.
Support and resistance areas are areas from which the price has repeatedly rebounded off.
Yellow lines are trend lines, trend channels and any other technical patterns.
Indicator 1 on the COT charts is the size of the net position of each category of traders.
Indicator 2 on the COT charts is the size of the net position for the "non-commercial" group.


