Technical Market Outlook
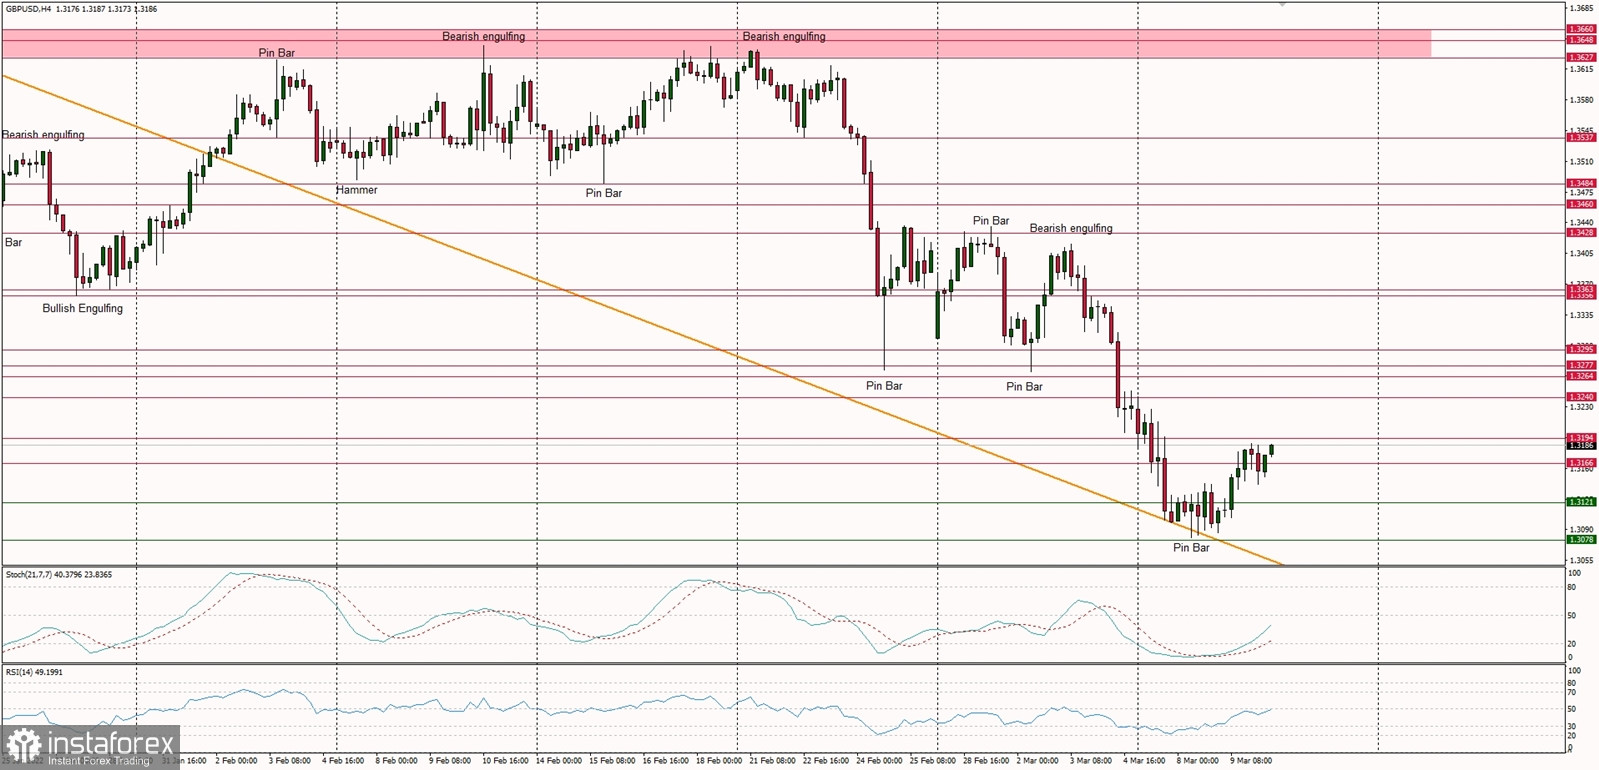
The GBP/USD pair has bounced after the trend line support test and is heading towards the nearest technical resistance located at 1.3194. The key technical resistance on the weekly time frame chart is located at 1.3749. The local demand zone seen between the levels of 1.3194 - 1.3166 might be good for a temporary bounce towards the level of 1.3240 - 1.3266, but it will not hold the bearish pressure for long. The market keeps trading inside the bearish zone and only a sustained breakout above the level of 1.3294 would temporary change the outlook to neutral. In a case of a breakout to the downside, the next long term technical support for bulls is seen at the level of 1.3038 and 1.3028.
Weekly Pivot Points:
WR3 - 1.3574
WR2 - 1.3504
WR1 - 1.3346
Weekly Pivot - 1.3272
WS1 - 1.3112
WS2 - 1.3030
WS3 - 1.2877
Trading Outlook:
If the market will break below the level of 1.3169, the up trend on the weekly time frame is terminated and the bears enforce and confirm their control over the market in the long term. The Cable is below 100 and 200 WMA already, so the bearish domination is clear. The next long term target for bears is seen at the level of 1.2751 and 1.2663. Please remember: trend is your friend.


