What is needed to open long positions on GBP/USD
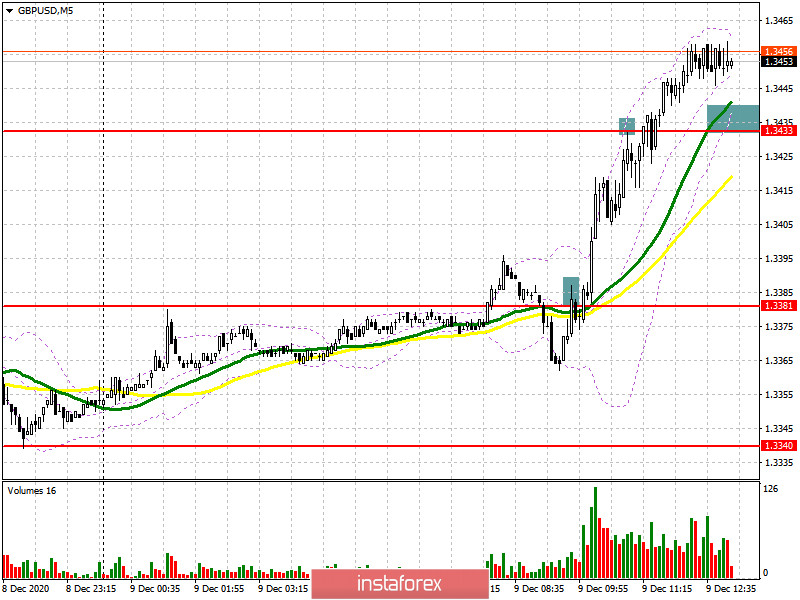
Even though the pound sterling showed a notable advance today, I couldn't benefit from this. Let's look at the 5-minute chart and discuss what actually happened and how I acted. In the first half of the trading day, the bears insisted on a fake breakout at about resistance of 1.3381. It was tested upwards that was viewed as a signal to open short positions on GBP/USD. However, such a decision brought losses. Today traders are focused on the summit between the EU and UK leaders. No wonder, that the market is behaving unusually. Any rumors on the Brexit front will trigger price gyrations. I didn't enter long positions because the pound sterling headed upwards rapidly after a stop loss of a short deal had been activated. So, the level of 1.3381 was not tested downwards. Selling from resistance of 1.3433 caused a 15-pip correction downwards. Then, the market continued its growth. I managed to exit the market at break even.

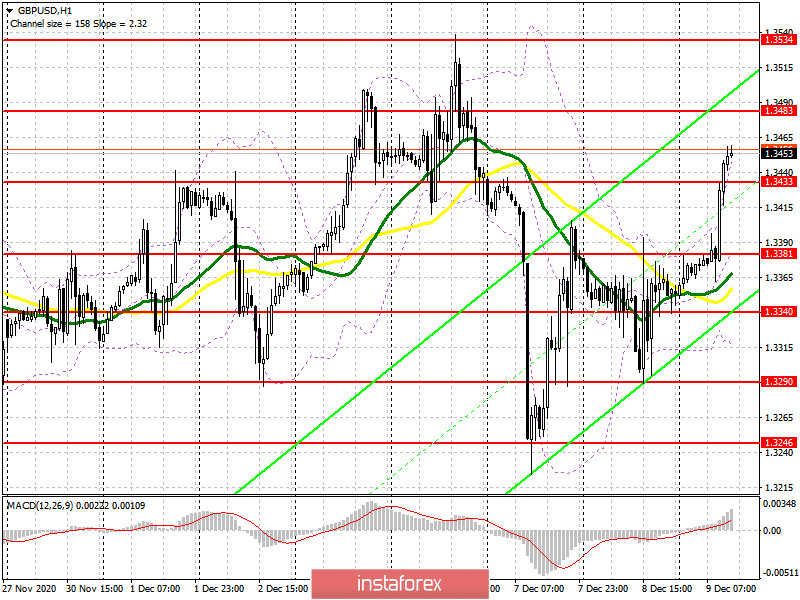
In the second half of the trading day, the buyers set the aim of defending support of 1.3433 where the bears are sure to retreat. A formation of a fake breakout there and good Brexit news will cement sentiment of large market players betting on GBP strength. This will open the door to highs at 1.3483 and 1.3534 where I recommend profit taking. 1.3534 will be broken on condition of good news on the trade deal. This will revive the bullish trend and the pair will hit fresh highs of 1.3604 and 1.3698. A higher target is expected at levels above 1.37. If the bulls lack activity at 1.3433 in the second half of the day, it would be better to postpone buying until the price retreats to support of 1.3381 or until a lower low of 1.3290 is tested. Then, it would be possible to open long positions during a bounce bearing in mind a 20-30-pip correction intraday. IMPORTANTLY, all these actions make sense BEFORE results of the summit between Boris Johnson and Ursula von der Leyen are unveiled. Once the results are announced, GBP/USD is set to trade with erratic gyrations. So, all these forecasts will be invalid.
What is needed to open short positions on GBP/USD
GBP bears have nothing to do but wait. If they manage to regain control over 1.3433 and test it upwards, this will form a good market entry point for short positions. As a result, GBP/USD will tumble to the low of 1.3381 and open the door to support of 1.3340. The sellers set deeper targets at 1.3290 and 1.3246, but they will be achievable only amid negative rumors about the Brexit summit. In case GBP extends growth, it would be possible to consider short positions with new resistance at 1.3482 and a downward 20-30-pip correction, just like it was after testing 1.3534 today. Large sellers will be interested in defending resistance at 1.3534 where the upward bias could stall temporarily. IMPORTANTLY, all these actions make sense BEFORE results of the summit between Boris Johnson and Ursula von der Leyen are unveiled. Once the results are announced, GBP/USD is set to trade with erratic gyrations. So, all these forecasts will be invalid.

Let me remind you that as of December 1, COT reports (Commitment of Traders reports) reveal buoyant demand for GBP as most traders are betting on the long-awaited trade agreement between London and Brussels. Long non-commercial positions increased from 30,838 to 37,087. At the same time, short non-commercial positions declined to 47,968 from 44,986 a week ago. As a result, the negative non-commercial net positions came in at -7,899 against -17,130 from a week earlier. This indicates that GBP sellers are still holding the upper hand in the market. Nevertheless, traders are regaining appetite for risk and the trade deal will cement it if it is eventually signed.
Signals of technical indicators
Moving averages
The pair is trading below 30- and 50-period moving averages. It indicates a further growth of GBP in the medium term.
Remark. The author is analyzing a period and prices of moving averages on the 1-hour chart. So, it differs from the common definition of classic daily moving averages on the daily chart.
Bollinger Bands
In case GBP/USD trades lower, a median indicator's line of 1.3315 will serve as support.
Definitions of technical indicators
- Moving average recognizes an ongoing trend through leveling out volatility and market noise. A 50-period moving average is plotted yellow on the chart.
- Moving average identifies an ongoing trend through leveling out volatility and market noise. A 30-period moving average is displayed as the green line.
- MACD indicator represents a relationship between two moving averages that is a ratio of Moving Average Convergence/Divergence. The MACD is calculated by subtracting the 26-period Exponential Moving Average (EMA) from the 12-period EMA. A 9-day EMA of the MACD called the "signal line".
- Bollinger Bands is a momentum indicator. The upper and lower bands are typically 2 standard deviations +/- from a 20-day simple moving average.
- Non-commercial traders - speculators such as retail traders, hedge funds and large institutions who use the futures market for speculative purposes and meet certain requirements.
- Non-commercial long positions represent the total long open position of non-commercial traders.
- Non-commercial short positions represent the total short open position of non-commercial traders.
- The overall non-commercial net position balance is the difference between short and long positions of non-commercial traders.


