


Yesterday, the pair went up and tested the resistance line at 1.3476 (red bold line) and then rolled back down, closing the daily candle at 1.3401. Today, the price will most likely continue to go down according to the economic calendar news, it is expected at 13.30 UTC (USD).
Trend Analysis (Fig. 1).
Today, the market will continue to go down from the level of 1.3401 (closing of yesterday's daily candle) with the target of 1.3312 - 21 average EMA (black thin line). After testing this line, it is possible to continue going down with the target of 1.3207 at the pullback level of 38.2% (blue dotted line).
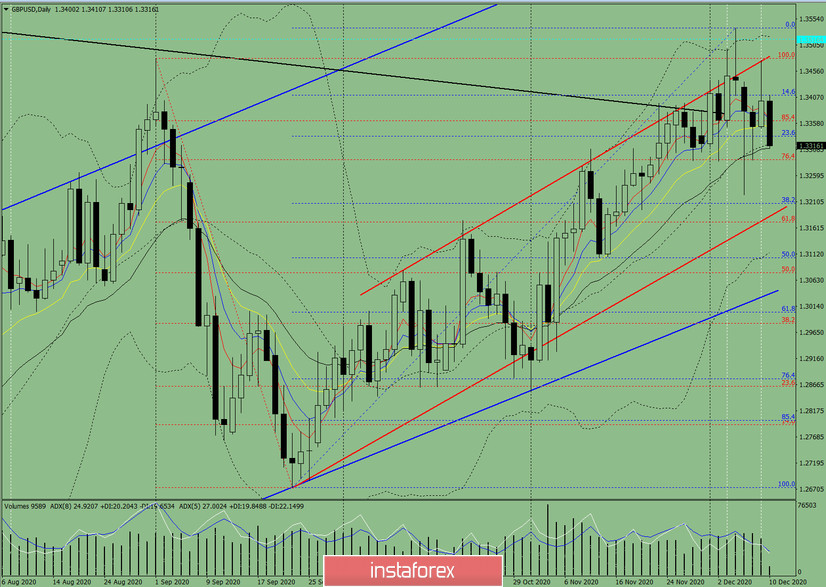
Figure 1 (daily chart).
Complex Analysis:
- Indicator Analysis – down
- Fibonacci Levels – down
- Volumes – down
- Technical Analysis – down
- Trend Analysis – down
- Bollinger Bands – down
- Weekly Chart – down
General Conclusion:
Today, the price will continue to go down from the level of 1.3401 (closing of yesterday's daily candle) with the target of 1.3312 - 21 average EMA (black thin line). After testing this line, it is possible to continue going down with the target of 1.3207 at the pullback level of 38.2% (blue dotted line).
Alternative scenario: after going down and reaching the 21 average EMA of 1.3312 (black thin line), the pair may start going up with the target of 1.3486 at the resistance line (red bold line).


