EUR/USD
Analysis:
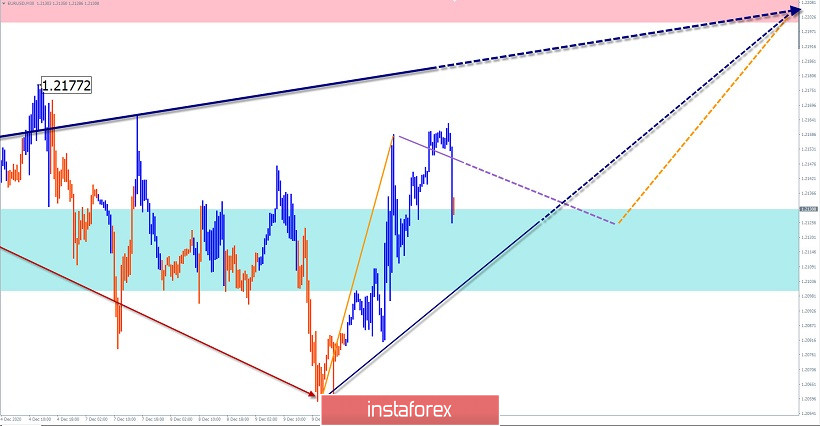
Analysis of the price chart of the European currency on the H4 time frame shows the upward rate of the incomplete wave from March 20. The last section of the trend has been reporting since November 4. Quotes are approaching the lower limit of the preliminary target zone.
Forecast:
After a possible attempt to decline today, we should expect a second spurt towards the dominant rate. The resistance zone runs along the lower border of a large-scale strong resistance, where you can expect a change in the pair's exchange rate.
Potential reversal zones
Resistance:
- 1.2200/1.2230
Support:
- 1.2130/1.2100
Recommendations:
Sales in the euro market are not recommended today. The main attention is paid to the search for signals to buy a pair.

GBP/JPY
Analysis:
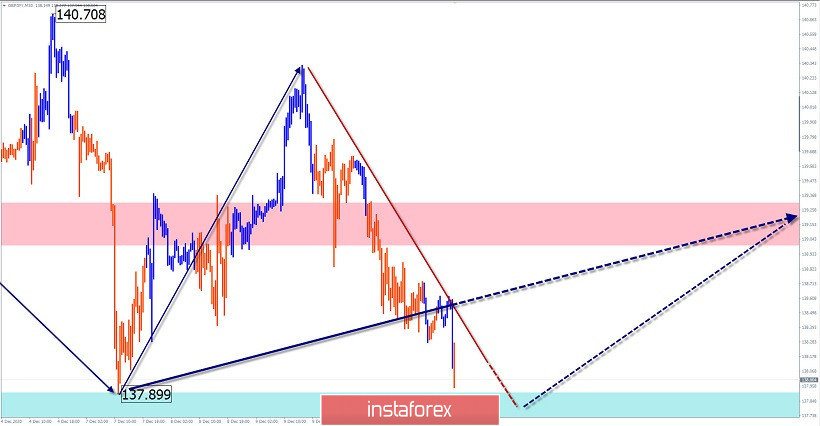
The current wave model is ascending, starting from September 22. Since December 7, after the completed sideways correction, a new upward zigzag is formed. The decline phase is nearing completion. There are no signals of an imminent change of course on the charts yet.
Forecast:
Today, on the chart of the pair, you can expect the full completion of the current bearish movement and the formation of a reversal. At the end of the day, there is a high probability of a price rise.
Potential reversal zones
Resistance:
- 139.00/139.30
Support:
- 137.90/137.60
Recommendations:
Sales today may be risky due to the limited potential for decline. It is recommended to track reversal signals to enter long positions in the area of calculated support.

Explanation: In the simplified wave analysis (UVA), waves consist of 3 parts (A-B-C). The last incomplete wave is analyzed. The solid background of the arrows shows the formed structure, and the dotted background shows the expected movements.
Note: The wave algorithm does not take into account the duration of the instrument's movements in time!


