


EUR/USD
Analysis:
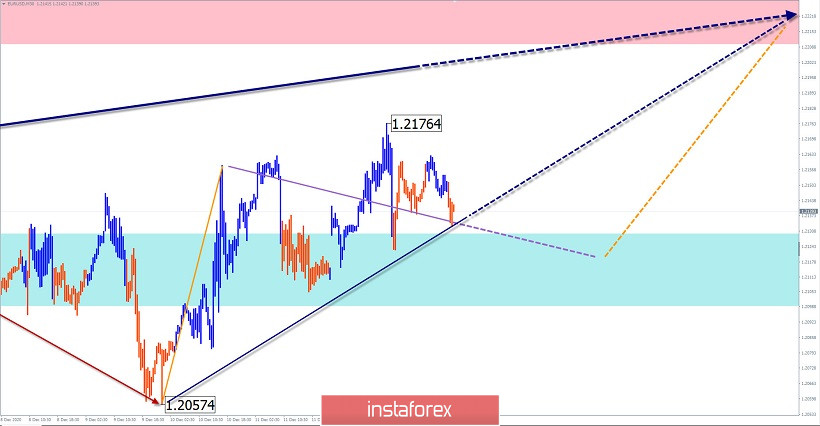
The upward wave of the European currency, which started in March, is approaching the lower border of the preliminary target zone. At the end of last week, another correction was completed. From this time on, the price forms a reversal pattern before the final break in the trend.
Forecast:
In the next trading session, there is a high probability of a flat movement with a downward vector. A breakout of the lower support limit is unlikely. By the end of the day, we expect an increase in the activity and the beginning of a price rise.
Potential reversal zones
Resistance:
- 1.2210/1.2240
Support:
- 1.2130/1.2100
Recommendations:
Sales in the euro market today may be unprofitable. In the area of the calculated support zone, it is recommended to look for signals to buy the pair.
AUD/USD
Analysis:
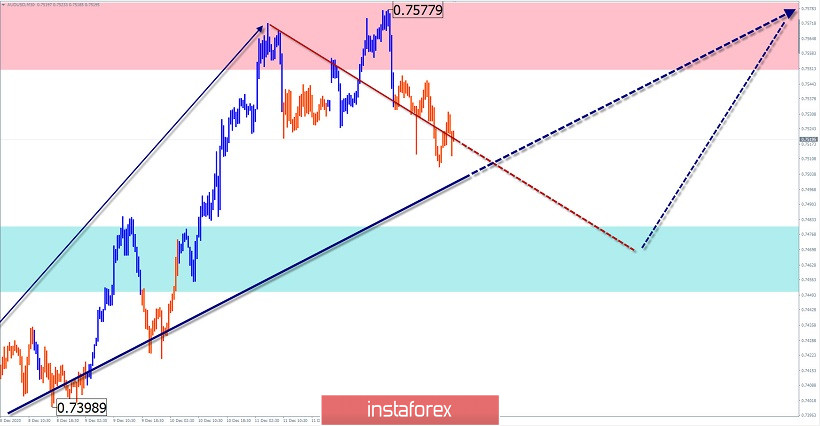
Since March of this year, the Australian dollar chart has been developing an upward trend on a daily scale. The unfinished section counts down from November 2. The price has reached the lower limit of the strong zone of a potential reversal of a large TF. A small-scale corrective zigzag has been forming since last Friday.
Forecast:
On the next day, the price is expected to move in the corridor between the opposite zones, mainly with a downward vector. In the European session, a short-term price rise to the resistance zone is possible.
Potential reversal zones
Resistance:
- 0.7550/0.7580
Support:
- 0.7480/0.7450
Recommendations:
Today, short-term sales with a reduced lot are possible on the "Aussie" market. It is safer to refrain from trading until the decline is complete.
GBP/JPY
Analysis:
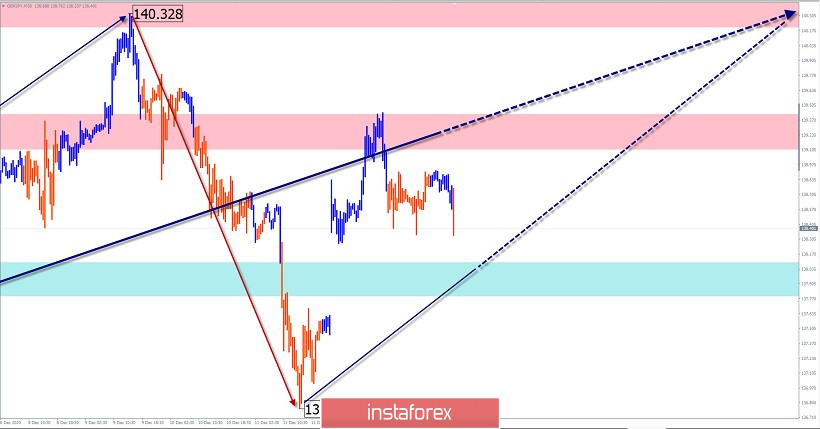
In the pair's market since the end of September, the trend is set by an upward wave. After a sideways correction from December 7, a reversal pattern is formed on the chart before the next jump in the main exchange rate. There is a clear zigzag in its structure.
Forecast:
In the current day, you can expect the completion of the downward movement of the pair, a reversal, and a second rise in the area of the nearest resistance. In case of a further upward breakout, the next target will be the next calculated zone.
Potential reversal zones
Resistance:
- 140.20/140.50
- 139.10/139.40
Support:
- 138.10/137.80
Recommendations:
Today, when selling the pair, there is a high probability of receiving losses. It is recommended to refrain from trading during the pullback and look for buy signals at the end of it in the support area.
Explanation: In the simplified wave analysis (UVA), waves consist of 3 parts (A-B-C). The last incomplete wave is analyzed. The solid background of the arrows shows the formed structure, and the dotted one shows the expected movements.
Note: The wave algorithm does not take into account the duration of the instrument's movements in time!


