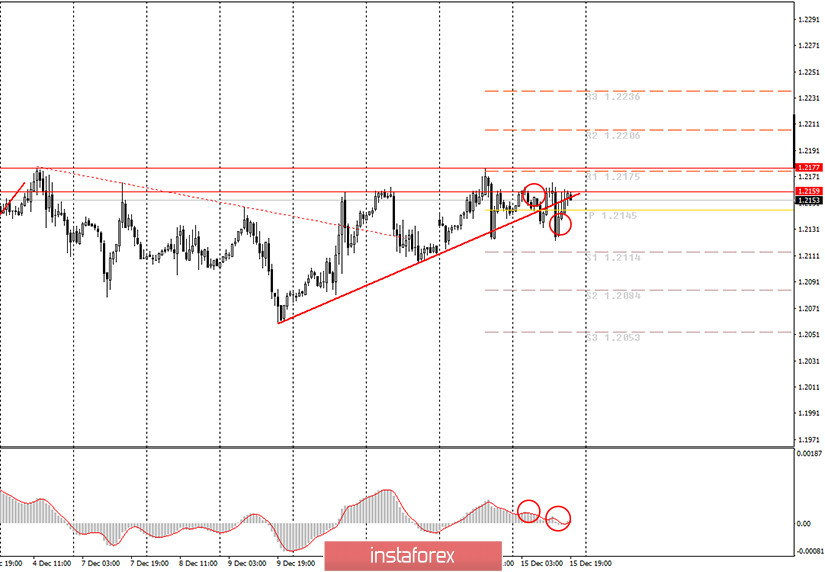
Hourly chart of the EUR/USD pair

The EUR/USD pair continued to trade in a narrow price range on Tuesday, completely ignoring all technical signals and constructions. However, novice traders themselves can see everything in the chart or in the terminal. Even beginners understand that now the pair is trading absolutely sluggish, illogical and unpredictable again. The quotes of the pair have reached the 1.2159 level three (!!!) times and all three attempts to overcome it ended in nothing. However, the downward movement did not start after that. Therefore, all three rebounds, which can generally be interpreted as sell signals, did not affect the course of trading in any way. In addition, two more sell signals from MACD were formed (circled in the chart). However, they did not lead to a downward movement that could be rejected. If by the first signal novice traders could enter the market and exit it with minimal losses, then they should not have entered at the second signal, since it formed 40 points down after the candlestick, which, taking into account the current volatility (44 points for today), is a lot. Yesterday the quotes were already trying to gain a foothold below this line, but then the consolidation was unconvincing. Today the pair did it twice and also without any results for further downward movement.
The US released a report on industrial production for November, which rose by just 0.4% and is 0.1% more than predicted. And that's all. And given the current volatility, it was generally possible not to look at the calendar of macroeconomic events. Donald Trump officially lost the election, as electoral colleges of all states voted and Joe Biden won with a score of 306-232. Of course, Trump's representatives immediately announced that they would continue to fight for "fair elections" and "they have enough time until January 20 to restore justice," but traders no longer react to this information and do not believe that the incumbent president will be able to change the results voting.
The European Union is set to publish business activity indices in the services and manufacturing sectors. The same indices will be published in America. However, the key event of the day will be in the evening. The Fed meeting and the announcement of its results. The parameters of monetary policy are expected to remain unchanged, so Fed Chairman Jerome Powell's press conference will be the most important.
Possible scenarios for December 16:
1) Long positions are not relevant at the moment, since we have not surpassed the 1.2159-1.2177 area. Therefore, you need to wait until the specified area has been overcome and afterwards, you can finally open buy orders while aiming for 1.2206 and 1.2236 and slightly higher, by 20 points. You also need to be prepared for the fact that the upward movement can end near this area.
2) Trading for a fall looks more appropriate, however, a strong bullish sentiment is still present in the market, and the bears were unable to start moving down even after at least seven rebounds from the 1.2159 level. Thus, novice traders can try to open short positions while aiming for 1.2114 and 1.2084, but then Stop Loss should be placed above the 1.2177 level.
On the chart:
Support and Resistance Levels are the Levels that serve as targets when buying or selling the pair. You can place Take Profit near these levels.
Red lines are the channels or trend lines that display the current trend and show in which direction it is better to trade now.
Up/down arrows show where you should sell or buy after reaching or breaking through particular levels.
The MACD indicator (14,22,3) consists of a histogram and a signal line. When they cross, this is a signal to enter the market. It is recommended to use this indicator in combination with trend lines (channels and trend lines).
Important announcements and economic reports that you can always find in the news calendar can seriously influence the trajectory of a currency pair. Therefore, at the time of their release, we recommended trading as carefully as possible or exit the market in order to avoid a sharp price reversal.
Beginners on Forex should remember that not every single trade has to be profitable. The development of a clear strategy and money management are the key to success in trading over a long period of time.


