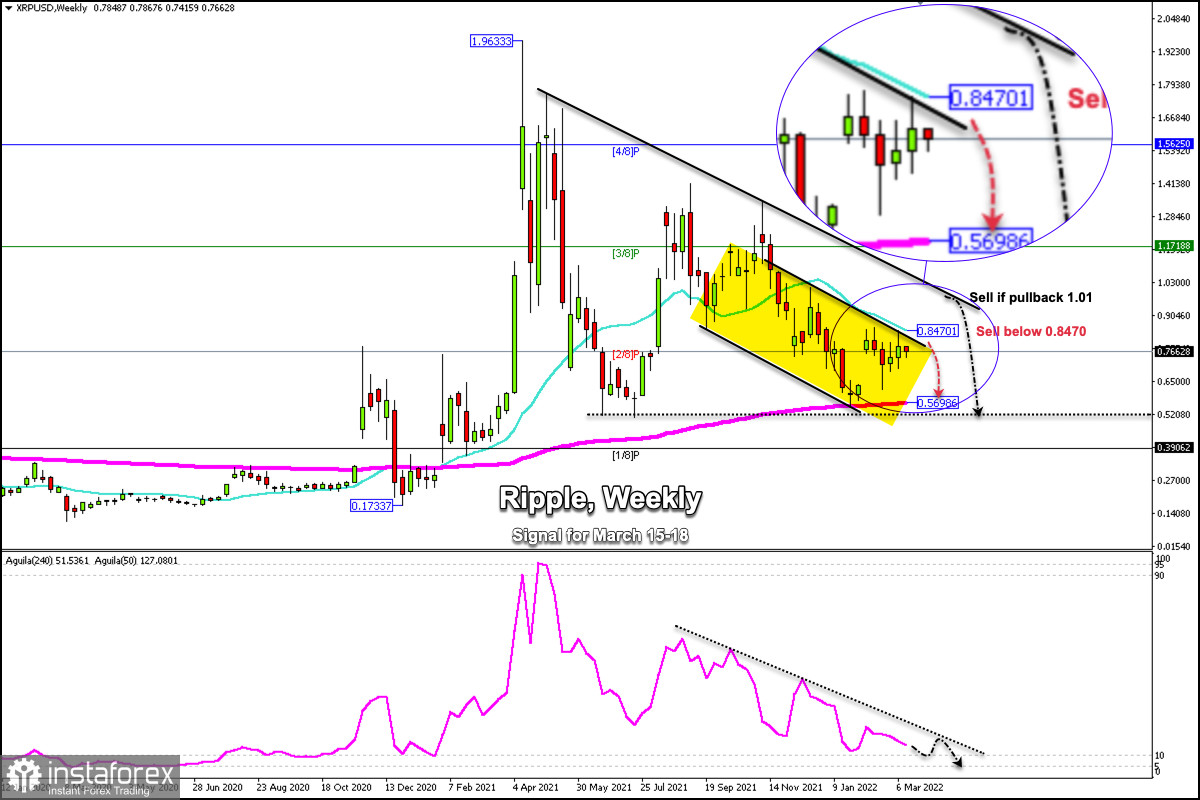
On the weekly chart, ripple (XRP/USD) is trading below the 21 SMA and inside a downtrend channel that was formed on September 19, 2021.
The downward pressure of XRP is evident because, since May 02, 2021, a downward trend channel is being crossed. The latest attempts to break this channel have failed and ripple has had a bearish sequence reaching the psychological level of 0.50 on 3 occasions.
On January 23, XRP reached the minimum of 0.5489, right at this same level is the EMA 200. From that level, it rebounded and was able to recover by more than 55%. It is now consolidating around 0.7640.
A pullback towards the 21 SMA located at 0.8470 could be a signal to sell with targets at 0.5698 (200 EMA).
Another stronger resistance is located at the top of the downtrend channel, which was formed in early May 2021. This level of 1.01 is also a psychological level and could act as a barrier and an opportunity to sell in the coming years. days.
Since July 2021, the eagle indicator has been oscillating below a downtrend channel. It is likely that this trend will continue in the coming days.
Our trading plan is to sell below 0.8470 with targets at 0.5698 and 0.5000. The eagle indicator supports our bearish strategy.


