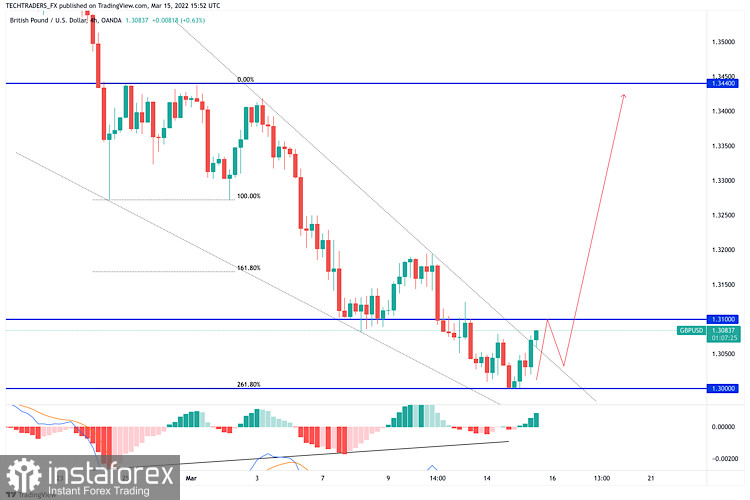
GBP/USD staled its early advance below the 1.3100 figure, now stable at around 1.3060. Upbeat UK employment figures maintain the British Pound afloat, despite increased demand for the greenback.
The Relative Strength Index (RSI) indicator on the four-hour chart stays near 40 and GBP/USD continues to trade below the 20-period SMA, suggesting that buyers are yet to control the pair's action.
Moreover, 4-hourly MACD has diverged in favor of the bulls. MACD histograms has produced higher lows , contradicting lower lows on the price chart. That bullish divergence indicates a potential for a corrective bounce which confirms the reversal chart pattern formation ( falling wedge) after the breakout of pattern.
1.3000 (psychological level, static level) aligns as significant support and additional losses toward 1.2920 (static level) could be witnessed in case this level turns into resistance.
Resistances are located at 1.3050 (static level, 20-period SMA), 1.3100 (psychological level, static level) and 1.3150 (static level, 50-period SMA).


