


To open long positions on GBPUSD, you need to:
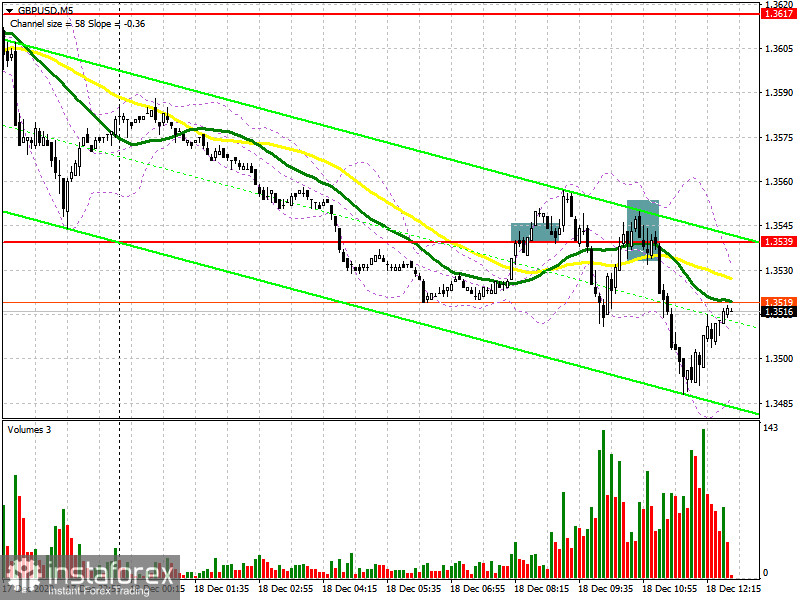
In my morning forecast, I paid close attention to the level of 1.3539 and recommended to act from it under several circumstances. Let's look at the 5-minute chart and talk about where you can and should have entered the market. The first was a deal to buy the British pound after the pair broke above the level of 1.3539 and tested it from the top-down, forming a convenient entry point into long positions. However, the trend did not develop, and the upward movement was no more than 17 points, after which the GBP/USD returned to the above level. Then the sellers began to act actively, and all we needed to continue the downward trend was a false breakout. That's exactly what happened. On the chart, I highlighted the area where an excellent entry point for short positions was formed, after which the pound fell by 50 points.
In the second half of the day, the main task of buyers will be to regain control over the resistance of 1.3539, which they failed to do during the European session. All goals remain the same as in the morning forecast. A breakout and test of the level of 1.3539 from top to bottom, similar to the purchase that I analyzed above, forms a signal to open new long positions in the continuation of the strengthening of GBP/USD, which will allow the pair to return to monthly highs in the area of 1.3617. The further bull market will depend on whether buyers manage to gain a foothold above this range. A break of 1.3617 will open a straight road to the highs of 1.3690 and 1.3750. However, such a scenario will be possible only if there is real information that a trade agreement on Brexit can be concluded in the near future. Any unexpected negative statements in this regard can lead to a sharp decline in the pound. If the pressure on GBP/USD continues in the second half of the day, I recommend looking at purchases from the level of 1.3448, provided that a false breakout is formed. You can buy GBP/USD immediately on the rebound from the minimum of 1.3362, counting on a correction of 20-30 points within the day.
To open short positions on GBPUSD, you need to:
The bears have kept the market under their control, and as long as trading is conducted below the level of 1.3539, we can expect a further fall in the pound. The nearest target in this scenario will be the support of 1.3448, where the first stop of the bear market will be. Only bad news on Brexit can help sellers get to this level, which will open a direct road to the further level of 1.3362, where I recommend fixing the profits. If by the beginning of the US session the pair gradually returns to the resistance area of 1.3539, and there will be no active sales from this level, it is better not to climb against the trend, but wait for the resistance update of 1.3617, from where you can sell the pound immediately for a rebound in the expectation of a correction of 20-25 points within the day. With good news on Brexit and a sharp rise in the pound, the nearest resistance levels will be the areas of 1.3648 and 1.3698.
Let me remind you that in the COT reports (Commitment of Traders) for December 8, there is a significant interest in the British pound. Long non-commercial positions rose from 37,087 to 39,344. At the same time, short non-commercial positions decreased from 44,986 to 33,634. As a result, the non-commercial net position became positive and jumped to 5,710 against a negative value of -7,899 a week earlier. All this suggests that traders are ready to bet on further strengthening of the pound at the beginning of next year and the preponderance of buyers even in the current situation when there is no agreement on a trade agreement, and just over two weeks are left until the end of the year.
Signals of indicators:
Moving averages
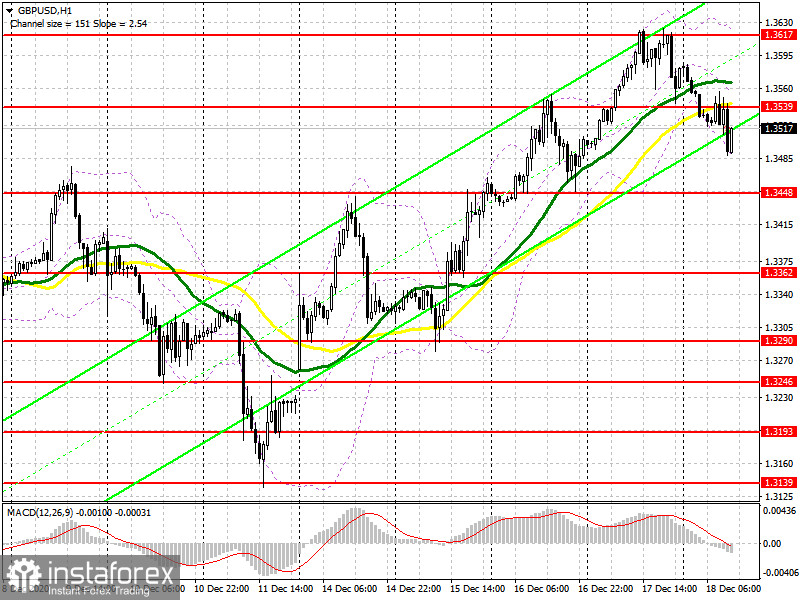
Trading is below 30 and 50 daily averages, which indicates that the bears are trying to maintain a downward correction in the second half of the day.
Note: The period and prices of moving averages are considered by the author on the hourly chart H1 and differ from the general definition of the classic daily moving averages on the daily chart D1.
Bollinger Bands
If the pair grows, the upper limit of the indicator in the area of 1.3617 will act as a resistance.
Description of indicators
- Moving average (moving average determines the current trend by smoothing out volatility and noise). Period 50. The graph is marked in yellow.
- Moving average (moving average determines the current trend by smoothing out volatility and noise). Period 30. The graph is marked in green.
- MACD indicator (Moving Average Convergence / Divergence - moving average convergence / divergence) Fast EMA period 12. Slow EMA period 26. SMA period 9
- Bollinger Bands (Bollinger Bands). Period 20
- Non-profit speculative traders, such as individual traders, hedge funds, and large institutions that use the futures market for speculative purposes and meet certain requirements.
- Long non-commercial positions represent the total long open position of non-commercial traders.
- Short non-commercial positions represent the total short open position of non-commercial traders.
- Total non-commercial net position is the difference between the short and long positions of non-commercial traders.


