To open long positions on GBP/USD, you need:
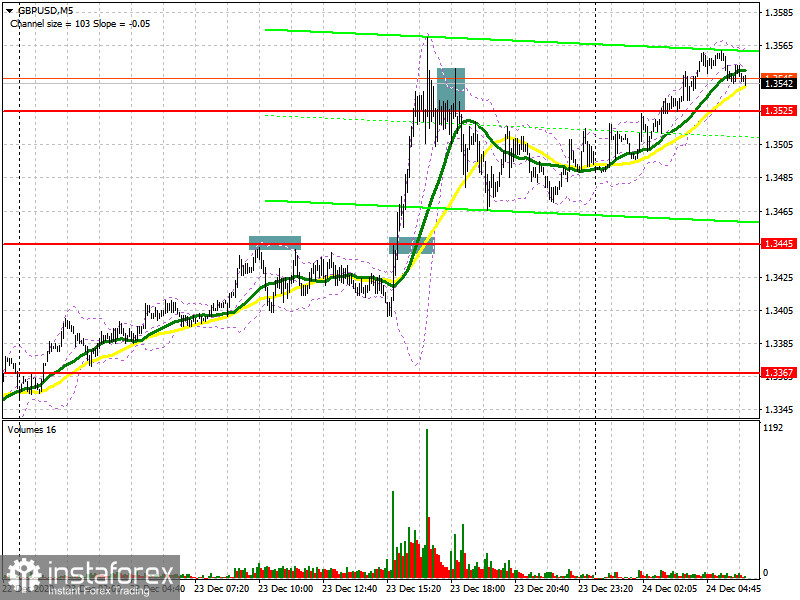
Yesterday there was news that the UK and the EU were on the verge of signing an agreement, which resulted in strengthening the British pound. As for the deals, let's look at the 5-minute chart and talk about where you can and should enter the market. A signal to sell the pound from the 1.3445 level appeared in the first half of the day. However, you should pay attention to the fact that there was no false breakout of the 1.3445 level, and if you missed this deal, then it's okay. The downward movement was around 40 points. Brexit news caused the pound to sharply rise, but after surpassing the 1.3445 level, I did not wait for a correction, so I was forced to miss such a large movement. However, it turned out pretty good to make money after the pair returned to the 1.3525 level in the afternoon. Testing it from the bottom up created a convenient entry point for short positions, and the downward movement was over 40 points.

Buyers are currently focused on resistance at 1.3566. A breakout and getting the pair to settle at this level while testing it from top to bottom creates a good entry point into sustaining the bull market, especially if it is officially announced that the UK and the EU have signed a trade deal. In this case, we can expect a larger upward movement to the high of 1.3623 and its update, with an exit to the area of 1.3690 and 1.3750, where I recommend taking profits. If the pound is under pressure in the morning, and today is a shortened trading day since it is Christmas Eve, then it is best to open long positions only after a false breakout is formed in the support area of 1.3474, where the moving averages also pass, playing on the side of the pound buyers. I recommend buying GBP/USD immediately on a rebound only from a low of 1.3404, counting on an upward correction of 35-40 points within the day.
To open short positions on GBP/USD, you need:
It is best not to rush to sell the pound today, as talk about a trade deal is more real than ever. Forming a false breakout in the resistance area of 1.3566, similar to yesterday's sales, will return the pressure to the pair and result in a downward correction to the support area of 1.3474, which will be quite difficult to surpass without bad news. Going beyond this level and testing it from the bottom up creates a good signal to open short positions in sustaining the downward trend, while aiming to fall to lows of 1.3404 and 1.3308, where I recommend taking profits. In case the pound grows further after news on the trade deal, I recommend not rushing to sell, but wait until new annual highs around 1.3690 and 1.3750 have been updated, where you can open short positions for a rebound, counting on a decline of 20-30 points within the day. The 1.3623 area will also be the intermediate resistance, which you should pay attention to.

The Commitment of Traders (COT) reports for December 15, there is a decrease in interest in the British pound for both buyers and sellers. Long non-commercial positions decreased from 39,344 to 35,128. At the same time, short non-commercial positions decreased from 33,634 to 31,060. As a result, the non-commercial net position, although it remained positive, dropped to 4,068, against 5,710 versus a week earlier. All this suggests that traders are taking a wait-and-see attitude, although a small preponderance of buyers, even in the current situation, continues to be observed. Given that the UK has imposed tough quarantine measures due to a new strain of coronavirus that has gotten out of control and for which there is no vaccine yet, then expecting the pound to strengthen further at the end of this year will not be the right decision. Only good news on Brexit can bring new players back into the market, betting on GBP/USD growth.
Indicator signals:
Moving averages
Trading is carried out above 30 and 50 moving averages, which indicates the pound's succeeding growth in the short term.
Note: The period and prices of moving averages are considered by the author on the H1 chart and differs from the general definition of the classic daily moving averages on the D1 daily chart.
Bollinger Bands
A breakout of the upper border of the indicator around 1.3570 will lead to a new wave of growth for the pound. In the event of a decline, support will be provided by the lower border of the indicator at 1.3415.
Description of indicators
- Moving average (moving average, determines the current trend by smoothing out volatility and noise). Period 50. It is marked in yellow on the chart.
- Moving average (moving average, determines the current trend by smoothing out volatility and noise). Period 30. It is marked in green on the chart.
- MACD indicator (Moving Average Convergence/Divergence — convergence/divergence of moving averages) Quick EMA period 12. Slow EMA period to 26. SMA period 9
- Bollinger Bands (Bollinger Bands). Period 20
- Non-commercial speculative traders, such as individual traders, hedge funds, and large institutions that use the futures market for speculative purposes and meet certain requirements.
- Long non-commercial positions represent the total long open position of non-commercial traders.
- Short non-commercial positions represent the total short open position of non-commercial traders.
- Total non-commercial net position is the difference between short and long positions of non-commercial traders.


