


Trend analysis (Fig. 1)
Today, the price from the level of 1.3620 (closing of yesterday's daily candle) will try to move upwards to the target of 1.3677 – the pullback level of 76.4% (yellow dotted line). After testing this line, the upward movement may continue to the next target of 1.3943 – the pullback level of 85.4% (yellow dotted line).
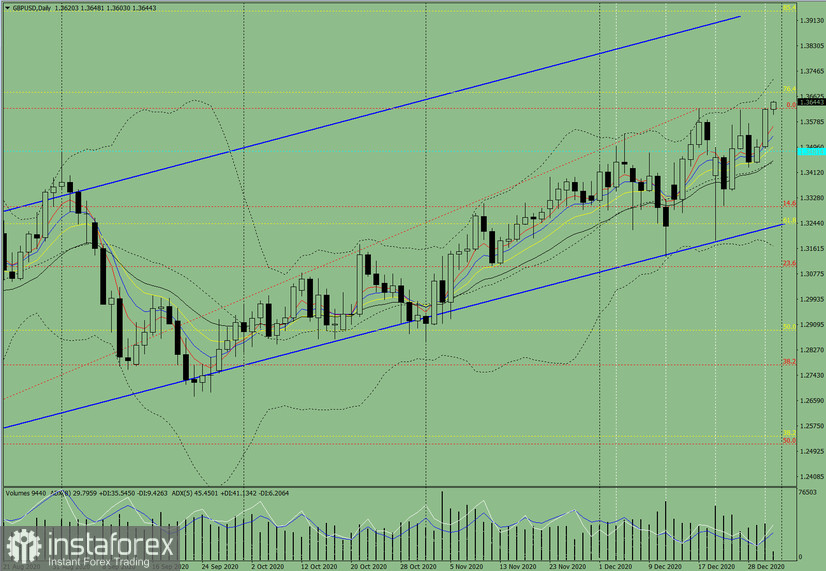
Figure 1 (daily chart).
Comprehensive analysis:
- Indicator analysis - up
- Fibonacci levels - up
- Volumes - up
- Candlestick analysis - up
- Trend analysis - up
- Bollinger lines - up
- Weekly chart - up
Overall conclusion:
Today, the price from the level of 1.3620 (closing of yesterday's daily candle) will most likely continue rising towards the target of 1.3677 – the pullback level of 76.4% (yellow dotted line). Upon testing this line, the upward movement may continue to the next target of 1.3943 – the pullback level of 85.4% (yellow dotted line).
An alternative scenario: the price from the level of 1.3620 (closing of yesterday's daily candle) may continue to move upwards to the target of 1.3677 – the pullback level of 76.4% (yellow dotted line). After testing this line, a downward pullback is possible, with the target of 1.3481 – the historical support level (blue dashed line).


