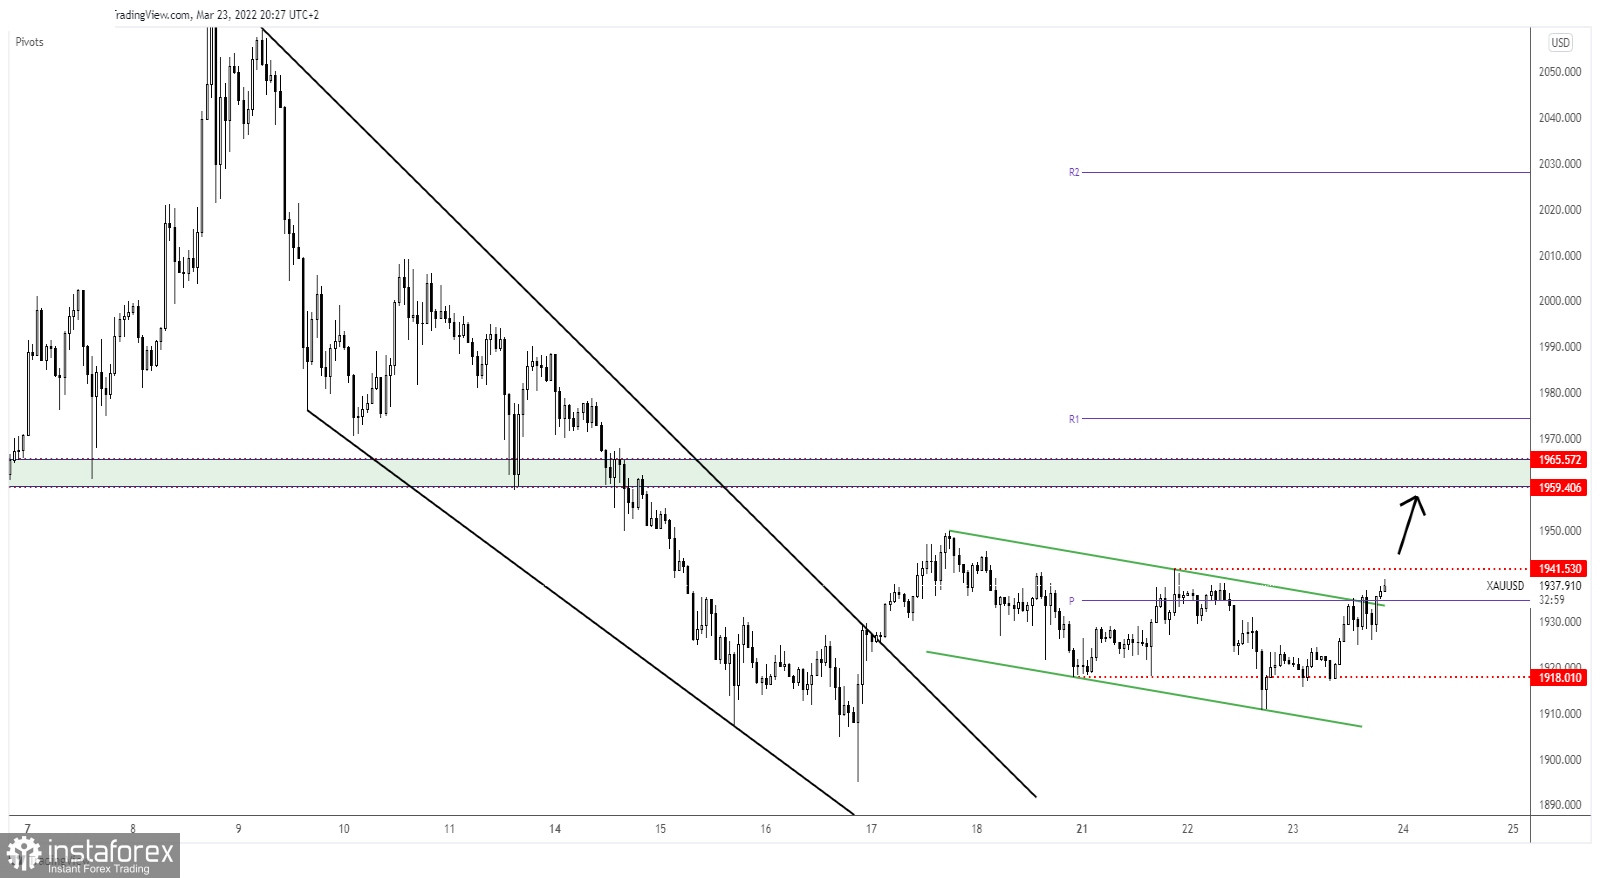
The price of gold is ralling at the time of writing. It's trading at the 1,939 level and it seems determined to approach and reach new highs. XAU/USD was in a temporary correction. It has developed a down-channel pattern that could bring new long opportunities.
Gold climbed higher also because the DXY plunged in the short term. Fundamentally, the UK CPI rose by 6.2% in February versus 6.0% expected, while the Core CPI registered a 5.2% growth compared to 5.0% estimates. As you already know, gold is used as a hedge against inflation. XAU/USD remains very attractive as long as the inflationary pressure grows.
XAU/USD Flag Pattern Breakout!

As you can see on the H4 chart, Gold found support on the 1,918 former low. Now it has managed to jump above the downtrend line and above the weekly pivot point of 1,934 which represented upside obstacles.
Now, it's almost to hit 1,941 former high. Technically, XAU/USD stayed right below the weekly pivot point and below the downtrend line, near this confluence area signaling an imminent upside breakout.
XAU/USD Outlook!
1,941 former high represents a static resistance. A valid breakout above it may activate an upside continuation and could bring new long opportunities.


