


Technical outlook:
The US dollar index continues to consolidate for the third day in a row between 98.50 and 98.90 mark. The index rallied through 98.90 highs on Thursday before finding resistance again and is now seen to be trading close to 98.70. Also note that Tweezer Top candlestick pattern was produced on the daily chart at Wednesday close.
The US dollar index is still working on a recent downswing between 99.30 and 97.70 mark. Prices have pulled back and stalled around 99.00 levels, which is the Fibonacci 0.786 retracement of above drop. If the structure holds well, prices would stay below 99.30 and turn lower towards 96.00 and 95.00 levels going forward.
The larger degree wave structure for US dollar index is also depicting a bearish outlook. The index dropped between 104.00 and 89.20 levels since March 2020 highs. The above has been retraced up to the Fibonacci 0.618 levels around 99.45 as seen on the chart. High probability remains for a drop lower from here toward 94.50 at least.
Trading plan:
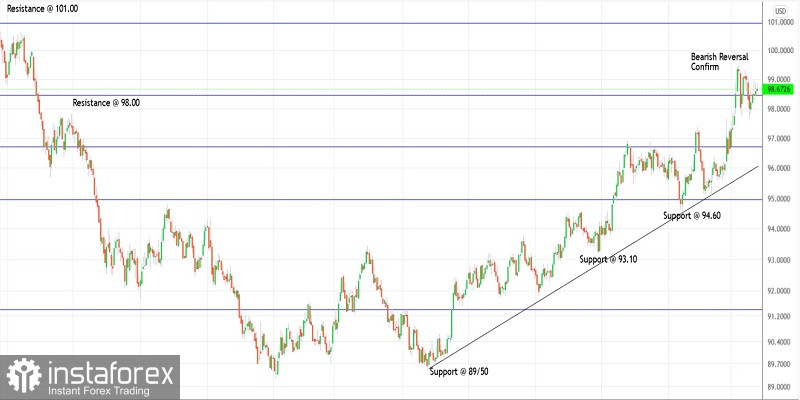
Potential drop to 94.50 against 100.00
Good luck!


