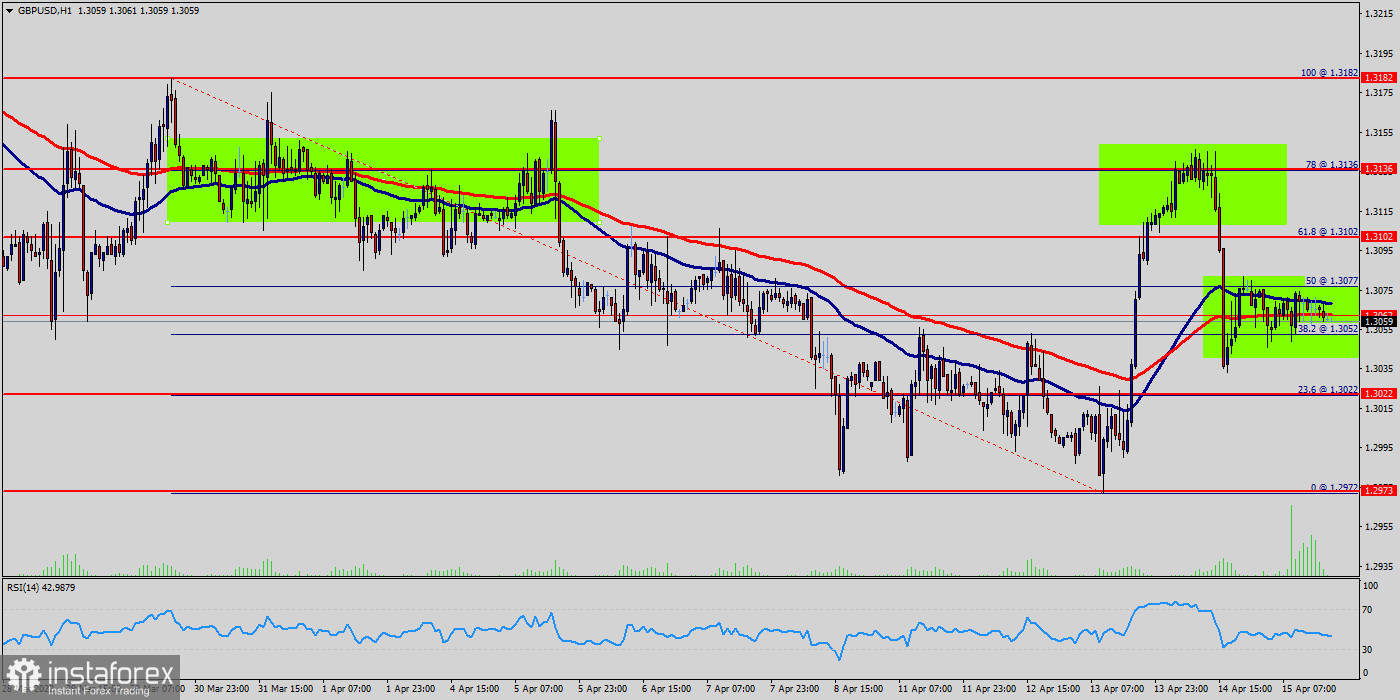
The GBP/USD traded higher and closed the day in positive territory around 1.3059. Today it has also slightly increased, having risen to the level of 1.3164, but the trend rebounded to 1.3059.
The GBP/USD pair has broken resistance at the level of 1.3052 which acts as support now. Thus, the pair has already formed minor support at 1.3052.The strong support is seen at the level of 1.3022 because it represents the weekly support 1.
On the hourly chart, the GBP/USD is testing resistance - the moving average line MA (100) H1 (1.3059). It may be necessary to look for entry points for selling at the end of the correction.
The trend of GBP/USD pair movement was controversial as it took place in a narrow sideways channel, the market showed signs of instability. Amid the previous events, the price is still moving between the levels of 1.3166 and 1.3022.
Also, the daily resistance and support are seen at the levels of 1.3166 and 1.3022 respectively. Therefore, it is recommended to be cautious while placing orders in this area. So, we need to wait until the sideways channel has completed.
Yesterday, the market moved from its bottom at 1.3035 and continued to rise towards the top of 1.3060. Today, in the one-hour chart, the current rise will remain within a framework of correction.
However, if the pair fails to pass through the level of 1.3102, the market will indicate a bearish opportunity below the strong resistance level of 1.3102 (the level of 1.3136 coincides with the double top too).
Since there is nothing new in this market, it is not bullish yet. Sell deals are recommended below the level of 1.3102 with the first target at 1.3022.
If the trend breaks the support level of 1.3022, the pair is likely to move downwards continuing the development of a bearish trend to the level 1.2973 in order to test the daily support 2 (horizontal red line).
On the contrary, if a breakout takes place at the resistance level of 1.3136 (the double top), then this scenario may become invalidated.


