Ethereum (ETH) Price Analysis | Trading ETH/USD
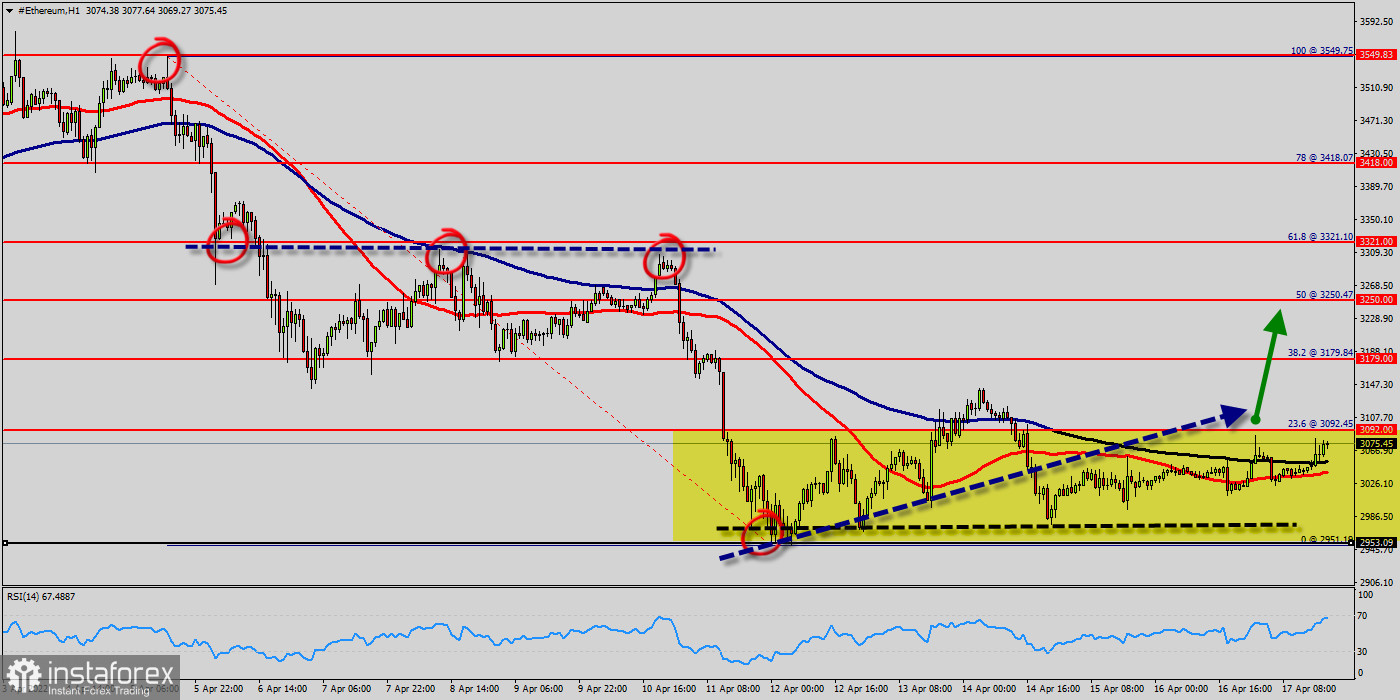
Ethereum price shows a vigorous from the bulls to keep the price above the price of $2,953 (weekly bottom, last bullish wave, the lowest price since last week). However, trading based on hope is never the wisest decision.
Ethereum price has a $3,250 target on the hourly chart 50% of Fibonacci retracement levels, but the price can still pull liquidity at $3,179 and lower before moving back up. The safest confirmation to join the uptrend will be a price spike above $2,953.
Ethereum has been going through a period of low volatility over the past week. The price is amongst the critical support at $2,953, and the bulls have so far successfully defended it.
The ETH/USD price is very close to the key levels between $2,953 and $3,092 (marked yellow), which has shown an excellent zone for a possible trend reversal.
Ethereum has reached a area of solid resistance on the hourly time frame, combined with the horizontal resistance at $3,092 (first resistance), the daily MA100 (marked by red), and the Fibonacci Retracement levels at 23.6% ($3,092 ). This barrier caused ETH to keep on getting rejected.
On the other hand, the ETH/USD price has been set above the strong support at the level of $2,953, which coincides with the double bottom at the same time frame. This support has been rejected four times confirming the veracity of an uptrend. These conditions are likely to point to a new bullish wave from the point $2,953 $3,000.
Our foresee in coming two days, Ethereum will continue to trade close to its resistance levels of $3,092 and $3,179 on Sunday, as some financial markets were closed for the holiday weekend. Volatility has slightly eased as a result, with ETH also hovering near its floor around $3,060 during today's session.
Now trading around $3,060, bulls remain set on keeping prices above $2,953, despite the momentum of the 50-day and 100-day moving averages mainly being bearish. The 14-day RSI also continues to track in oversold region, after failing to break out of the $2,953 support level earlier this week.
The RSI starts signaling an upward trend. Consequently, the market is likely to show signs of a bullish trend. So, it will be good to buy above the area of $2,953/$3,060 with the first target at $3,092 and further to $3,179 in order to test the daily resistance.
Nevertheless, if Ethereum price goes below this key level, we can expect the fall to expand. Until then, it is better, as we said in the previous analysis, to avoid emotional decisions and act more cautiously - daily range $2,953 - $3,179.


