


Pivot : 1.0860.
The EUR/USD price has shown considerable strength as it bounces off a crucial resistance confluence. This bounce is similar to the last two retests that led to a massive upswing around the area of 1.0860.
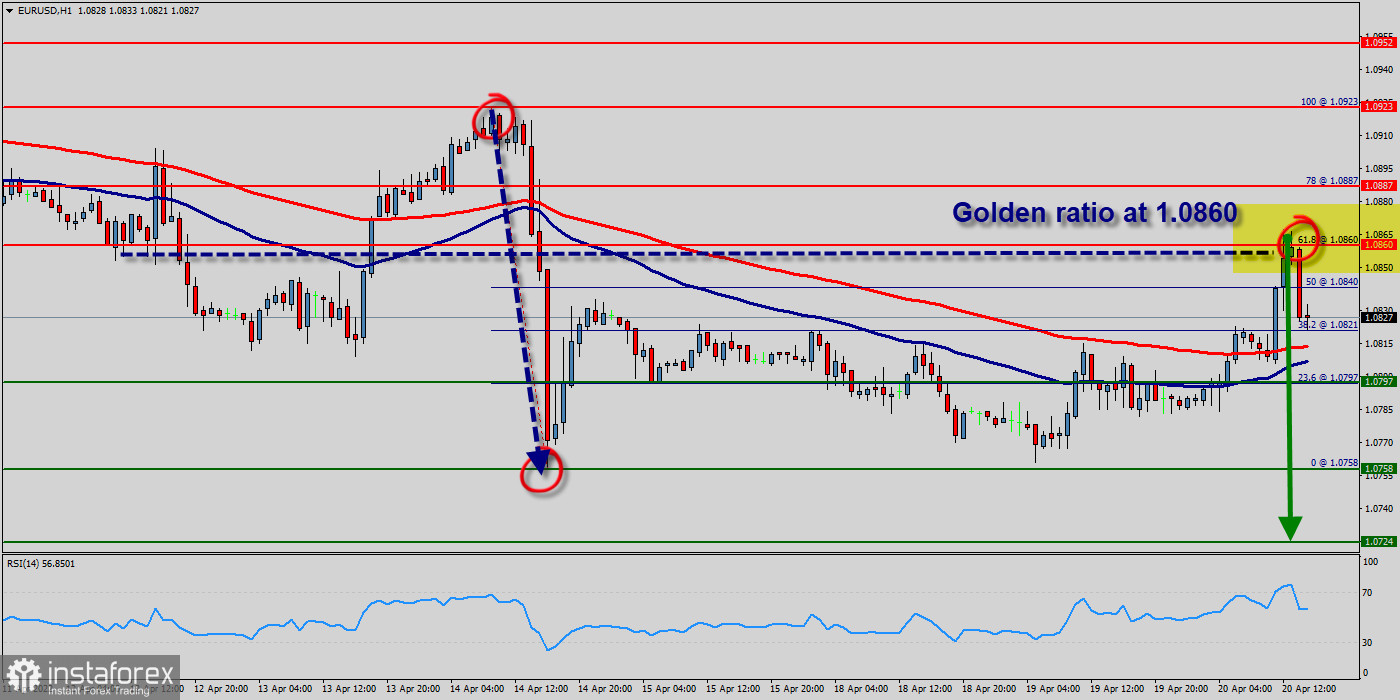
The bulls attempted to test and break above the 1.0860 resistance level but failed, because the price of 1.0860 represents a golden ration on the hourly chart.
Price is testing major resistance at 1.0860 (61.% of Fibonacci retracement, bearish bar harmonic formation). We expect to see a strong reaction off this level to push price down towards 1.0797 before 1.0758 support (Fibonacci retracement, horizontal swing low support).
The EUR/USD pair is in a falling trend channel in the medium long term. This signals increasing pessimism among investors and indicates further decline for Euro currency. The currency has support at points 1.0758 and resistance at points 1.0860. The currency is assessed as technically slightly negative for the medium long term.
Today, in the one-hour chart, the current rise will remain within a framework of correction. However, if the pair fails to pass through the level of 1.0860, the market will indicate a bearish opportunity below the strong resistance level of 1.0860.
Since there is nothing new in this market, it is not bullish yet. Sell deals are recommended below the level of 1.0860 with the first target at 1.0797. If the trend breaks the support level of 1.0797, the pair is likely to move downwards continuing the development of a bearish trend to the level 1.0758 in order to test the daily support 2 (horizontal green line).
Tip :
RSI is a (momentum indicator). It works by comparing the magnitude of the recent growth to recent downturns to measure the speed and change of price movements. RSI oscillates between 1 and 100. It is a general belief that RSI should be under 30 for buying and over 70 for selling.
On our trading today the RSI (14) sets under 70. So, RSI (14) sees a bearish exit of our ascending support-turned-resistance line signalling that we'll likely be seeing some bearish momentum from here.
To conclude, The EUR/USD pair trading is definitely an exciting pair, one that many people want to get involved in. However, it is important to understand the movement market before you begin trading.
Forecast :
Sell below the spot of 1.0860 with the targets of 1.0797 and 1.0758. Stop loss should be placed at 1.0970 (above the double top 1.0923).


