


Bitcoin continues to trade around $38,000-$39,000. Price remains in a bearish trend but it is also stuck right above the key support at $38,000. The RSI has formed a triangle pattern and it is running out of space. We can soon see a break out in the RSI and thus in price. The FOMC will be the trigger?
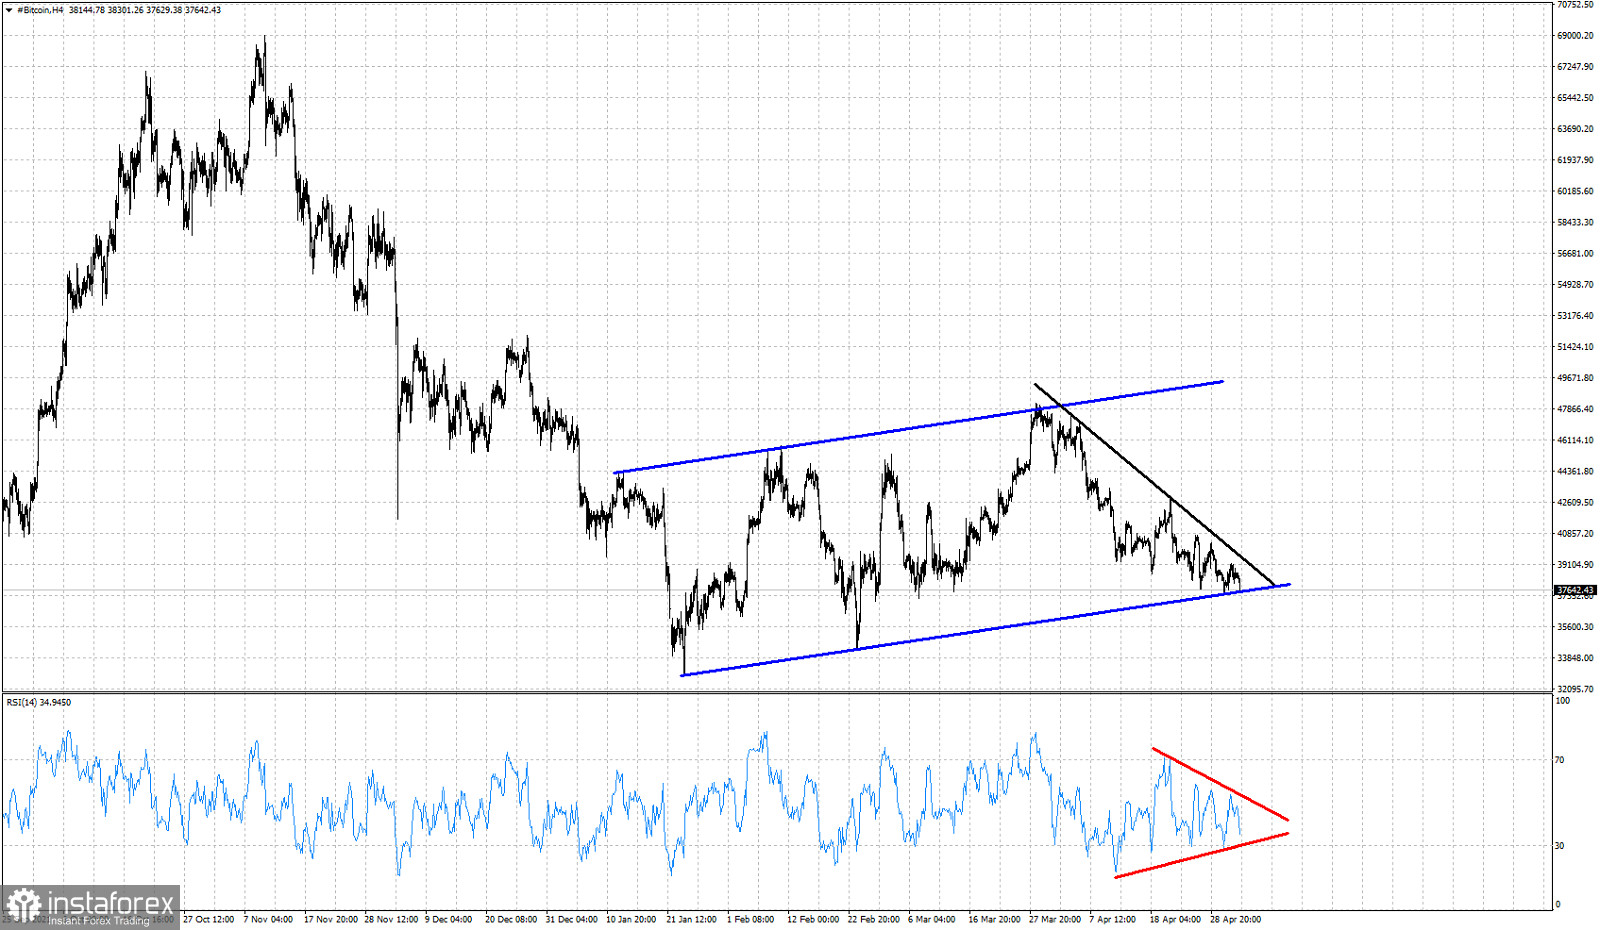
Red lines- triangle pattern
Black line -resistance
Bitcoin is trading just above key support. A break above the black resistance trend line at $39,500 will be a bullish sign that could be the start of an upward reversal. Bitcoin could start its next leg higher towards $50,000 if this black resistance is broken and the RSI breaks the triangle to the upside. If the triangle is broken to the downside then most probably will at the same time see Bitcoin below $38,000 support and moving towards $30,000.


