


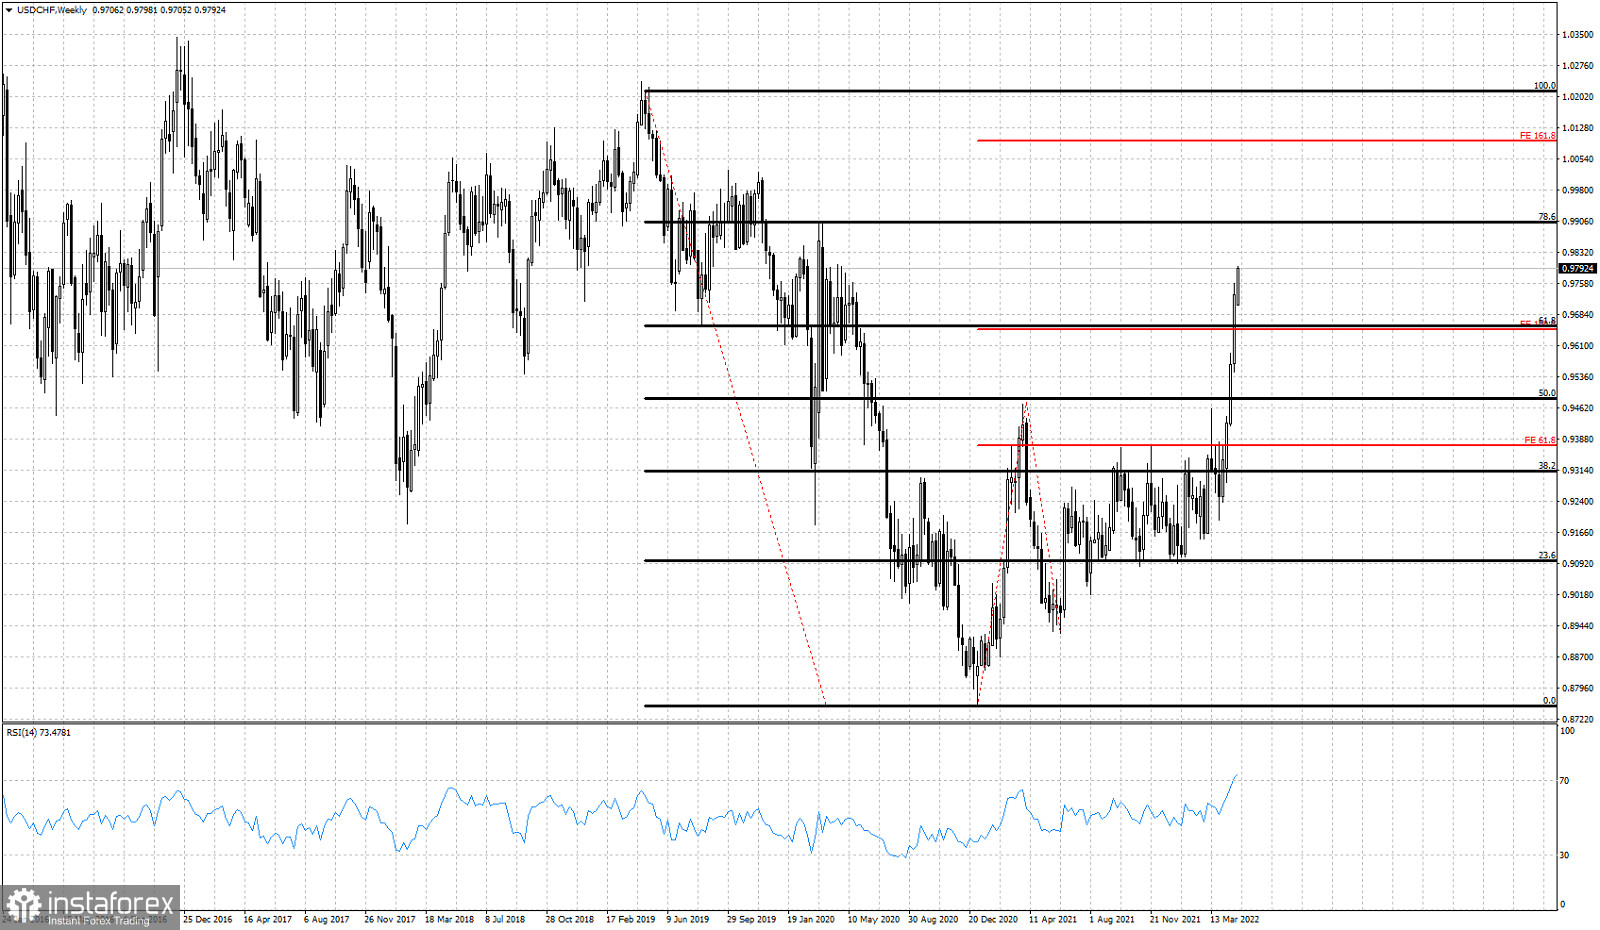
USDCHF is trading around 0.9790 in a short-term bullish trend. Our bullish signal was given when price broke above 0.9475 and the horizontal resistance. Since then price has not looked back and bulls keep on marching higher in a parabolic pattern.
Red lines - Fibonacci extensions
The USDCHF has broken above the 61.8% Fibonacci retracement resistance of the decline from 1.0236 to 0.8756. Next target is at the 78.6% retracement level at 0.99 as we mentioned in a previous post. The RSI is approaching overbought levels just one day before the FOMC. Traders need to be very cautious as tomorrow we might see a reversal in the Dollar and a period of weakness.


