


We have been bullish USDCHF since it broke above the key resistance at 0.9475. Our first target after the break out was at 0.966 and our second one at 0.99. Short-term trend remains bullish and price has formed a parabolic rise so far.
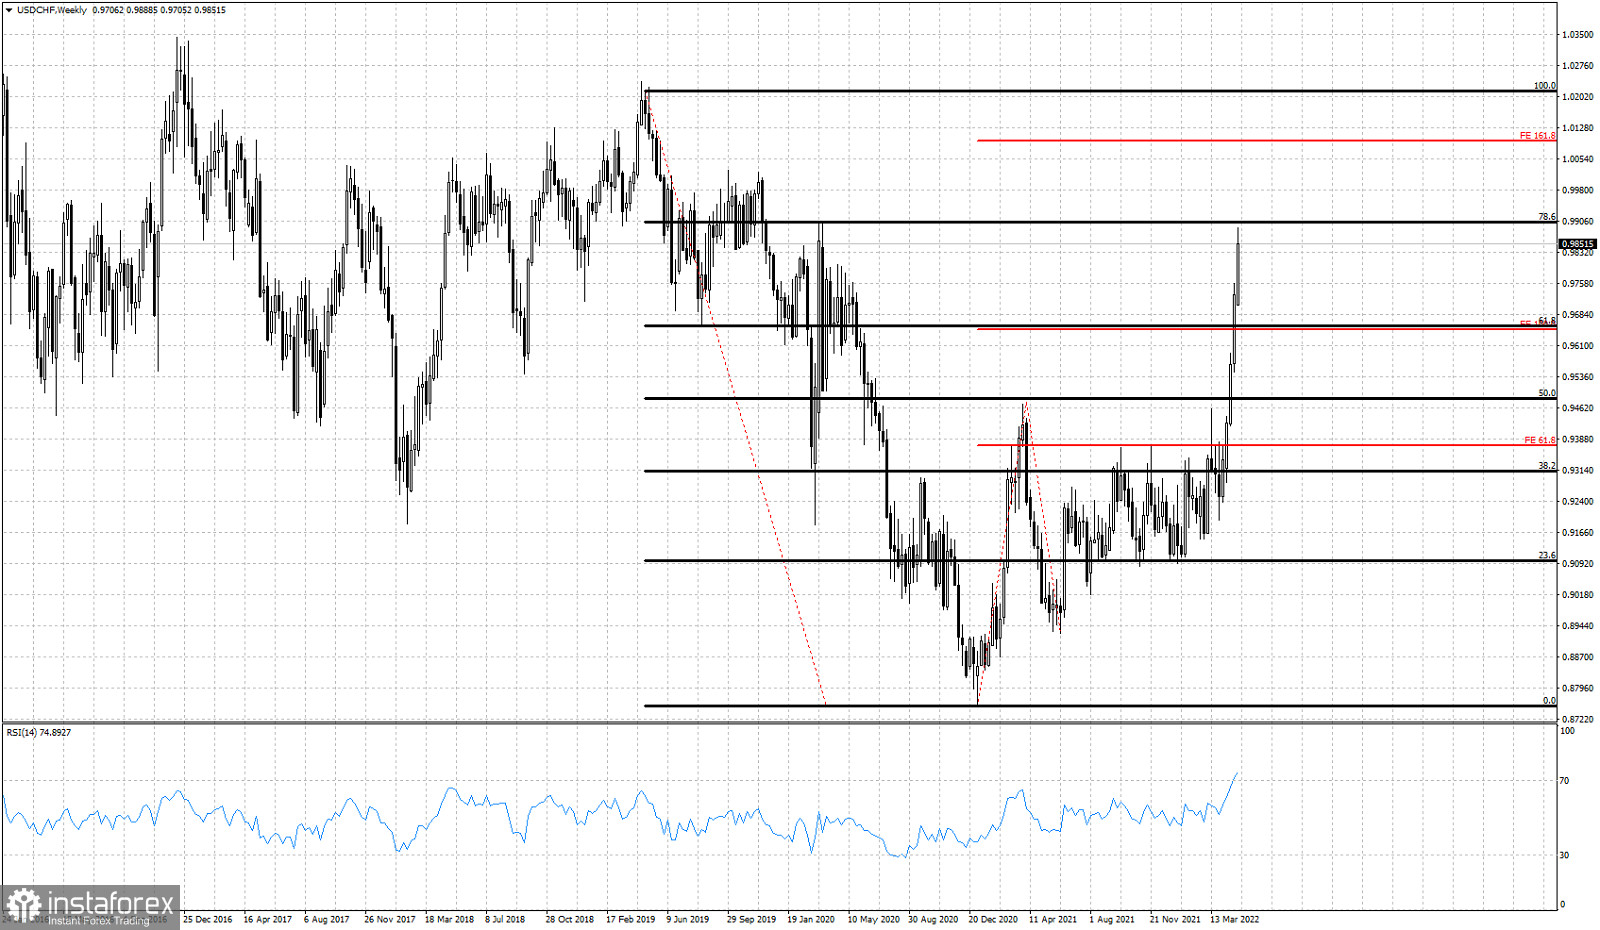
Black lines- Fibonacci retracements
USDCHF has surpassed the 61.8% Fibonacci retracement and is now challenging the 78.6% level. So far price is extending above the 100% of the first leg higher. Next target is at 1 where we find the 161.8% Fibonacci extension target. Trend remains bullish and there is now sign of a reversal. In the 4 hour chart a bearish divergence is evident as the RSI is not making higher highs as the price of USDCHF. This is just a warning. Not a reversal signal.


