Pound red weekly candle in progressTechnical Market Outlook:
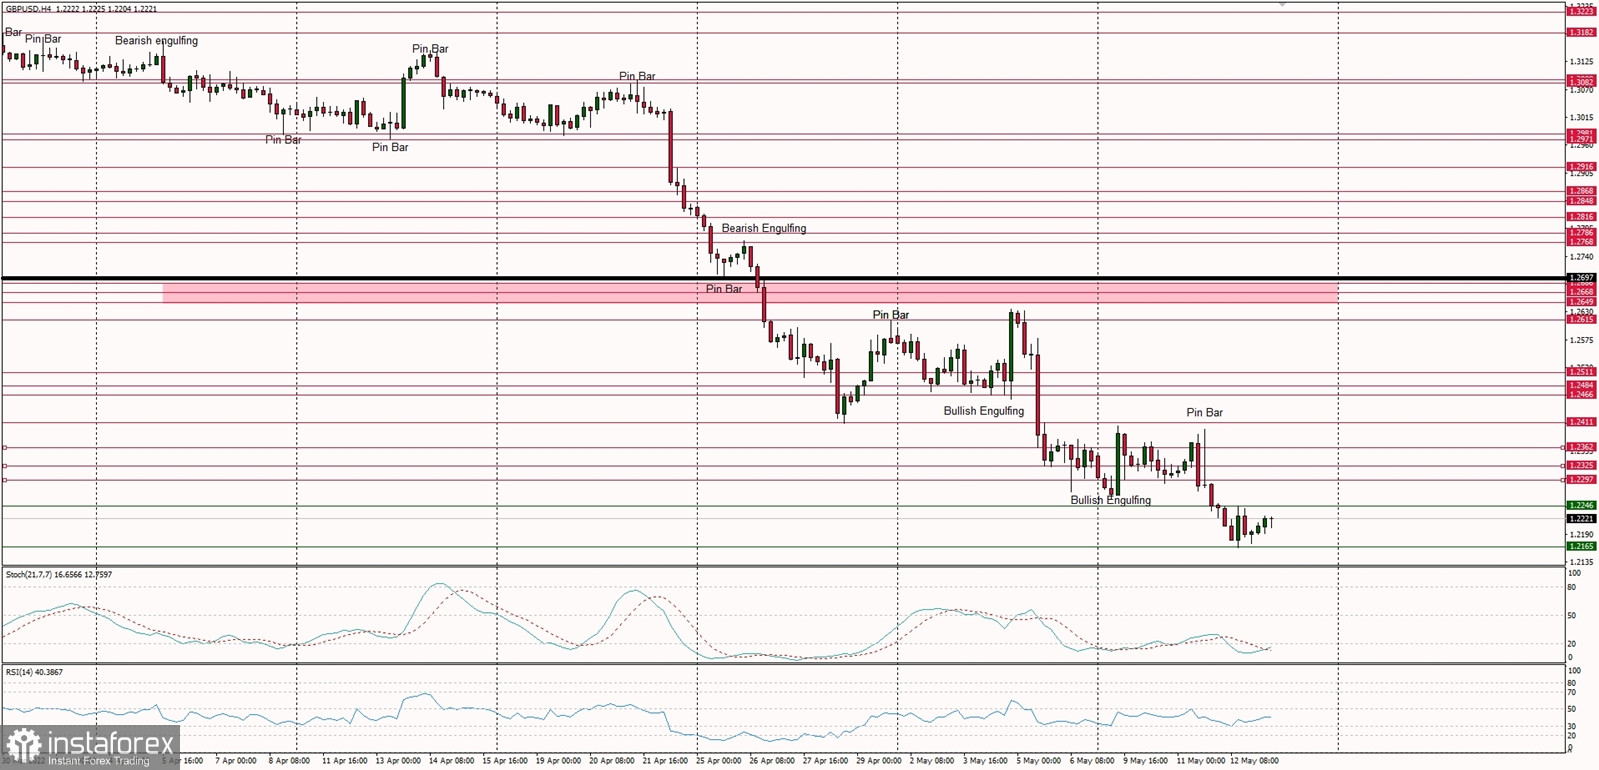
The GBP/USD pair has made a new swing low at the level of 1.2165 as the down trend continues. Despite the oversold market conditions on the H4 and Daily time frame charts there is no indication of trend termination or reversal just yet. The weekly time frame chart is showing a big red candle, which might be the 4th red weekly candle in the row. The bearish pressure continues and the next technical support is seen at the level of 1.2165 and 1.2072. The immediate intraday technical resistance is located at 1.2246.
Weekly Pivot Points:
WR3 - 1.2882
WR2 - 1.2750
WR1 - 1.2519
Weekly Pivot - 1.2392
WS1 - 1.2142
WS2 - 1.2037
WS3 - 1.1765
Trading Outlook:
The price broke below the level of 1.3000, so the bears enforced and confirmed their control over the market in the long term. The Cable is way below 100 and 200 WMA , so the bearish domination is clear and there is no indication of trend termination or reversal. The next long term target for bears is seen at the level of 1.1989. Please remember: trend is your friend.


