


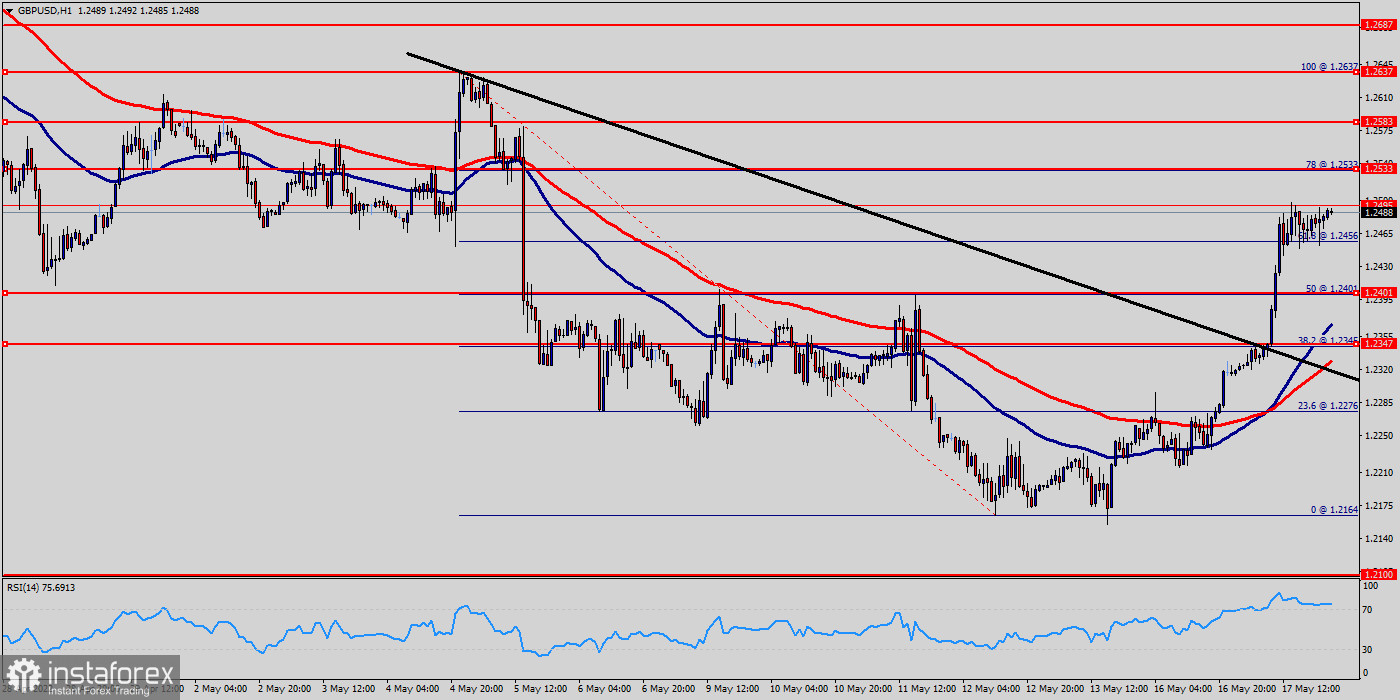
The GBP/USD pair continued moving upwards from the level of 1.2347. The pair rose from the level of 1.2347 (weekly support) to the top around 1.2488.
Today, the first support level is seen at 1.2401 followed by 1.2347, while daily resistance is seen at 1.2533.
According to the previous events, the GBP/USD pair is still moving between the levels of 1.2401 and 1.2533; for that we expect a range of 132 pips in coming hours.
This would suggest a bullish market because the RSI indicator is still in a positive area and does not show any trend-reversal signs. This is confirmed by the RSI indicator signaling that we are still in a bullish market.
The price is still above the moving average (100) and (50). Furthermore, if the trend is able to break out through the first resistance level of 1.2583, we should see the pair climbing towards the new double top (1.2637) to test it.
On the contrary, if a breakout takes place at the support level of 1.2347, then this scenario may become invalidated. Remember to place a stop loss; it should be set below the second support of 1.2276.


