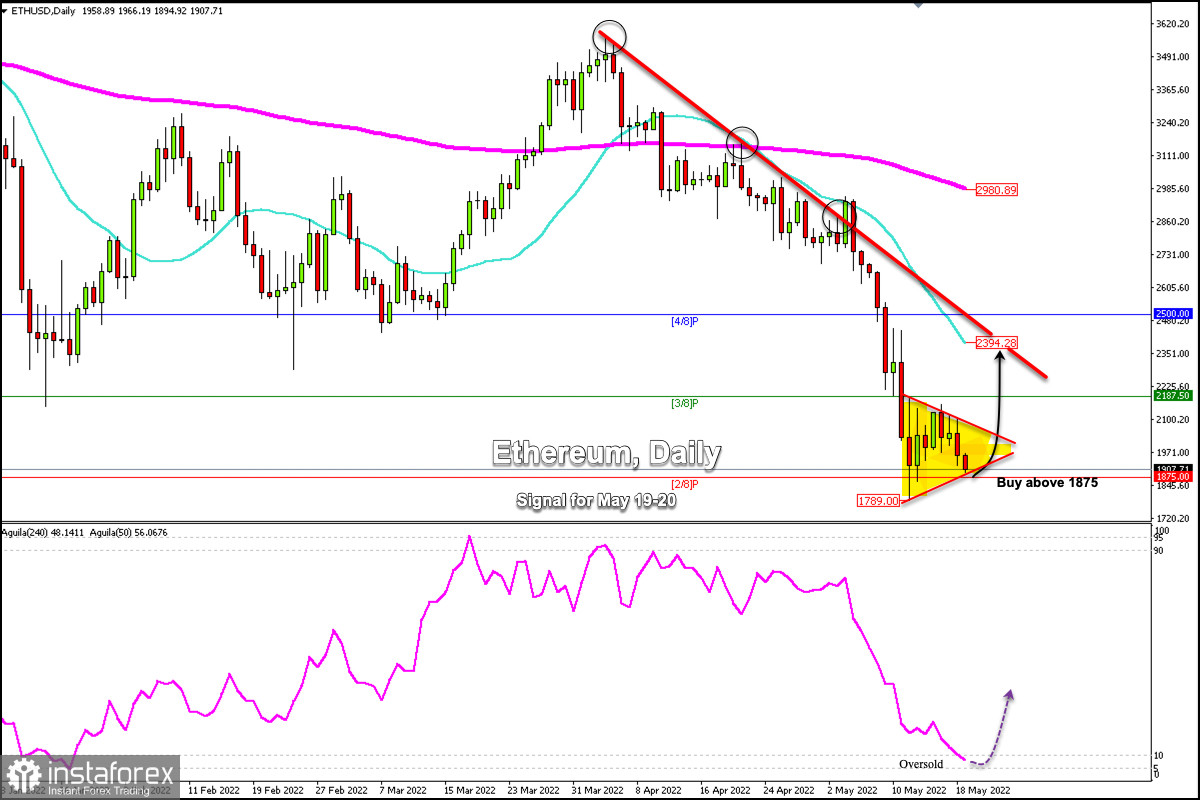
Ethereum (ETH/USD) fell below 2,000, having failed to overcome the resistance of 3/8 Murray at 2,187. On-chain data shows that ETH is trading around a key support level located at 1,875 which, if broken, could result in significant losses.
The price of Ethereum set an all-time high at $4,868 on November 10, 2021. Since then, it has lost more than 60%.
According to the daily chart, Ethereum registered a low of 1,789 on May 10. Since then, it has bounced to 2,187, unable to overcome this resistance and fell again towards the support of 1,875.
From May 10 until now, Ether has been forming a symmetrical triangle pattern. In the next few hours, we expect ETH to bounce back above 2/8 Murray and it could reach 3/8 Murray and could even reach the 21 SMA located at 2394.
For now, Ethereum is trading above the support of 1,875 and around 1,907 which has also become a strong bottom.
In the event that the downward pressure persists and ETH closes below 1,789 on the daily chart, the price of ETH could slide to the next stable bottom at 1,562, where 1/8 Murray is located, which is an area of strong technical reversal.
On the contrary, as long as ETH trades above 1,875, we could expect a recovery and the price could reach the top of the downtrend channel at around 2,394 in the next few days.
The eagle indicator has reached the extremely oversold zone of around 5 points. This is an imminent sign that we could expect a recovery of ETH in the next few hours and it could break above the psychological level of $2,000.
Our trading plan for the next few hours is to buy ETH/USD above 1,875, with targets at $2,000, 2,187(3/8), and 2,394 (21 SMA).


