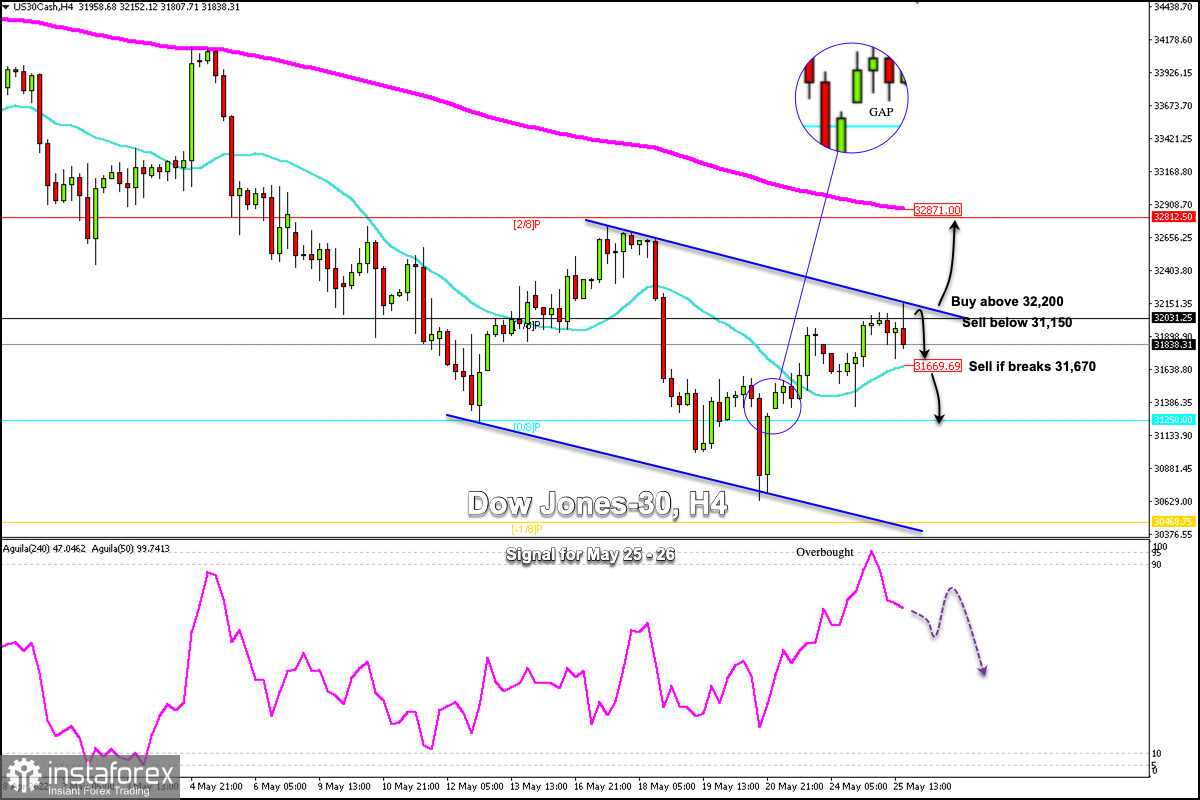
The Dow Jones-30 Industrial Index is trading lower midway through the American session today, but within the trading range of yesterday.
The 4-hour chart suggests investor indecision and impending volatility. It could also be signaling a sharp downside if the price breaks the 21 SMA located at 31,670.
Investors are worried about supply problems and rising costs due to inflation that is hurting corporate profits and derailing manufacturing output.
The main trend is down according to the daily and 4-hour charts. However, the momentum is growing showing some recovery. A trade through 32,870 will change the main trend to the upside. A trade through 30,629 will signal a resumption of the downtrend.
According to the 4-hour chart, we can see that the Dow Jones is trading within a downtrend channel formed on May 12.
Early in the American session, the DJ30 reached the top of the downtrend channel and failed to break it. Since then, it is falling and is likely to find support at the 21 SMA located at 31,670.
On the other hand, a sharp break below the 21 SMA could accelerate the decline towards 0/8 Murray located at 31,250.
Around this area, we can see that on May 20, the Dow Jones left a GAP that has not closed yet, which is likely to cover it in the coming days.
On the contrary, a sharp break in the downtrend channel and a close above 32,200 on the daily chart could encourage the recovery of the DJ30 and it could reach the area 2/8 Murray at 32,812 and even EMA 200 at 32,871.
Our trading plan for the next few hours is to sell the Dow Jones-30 below 31,150, with targets at 31,600 and 31,250. Since May 24, the Eagle indicator has been giving an overbought signal, which supports our bearish strategy.


