


Ethereum is around $1,900 bouncing from the horizontal support zone at $1,700. Short-term trend remains neutral as price continues trading sideways. There is no clear trend in the near term for Ethereum as price has not made any real progress and continues trading mostly sideways.
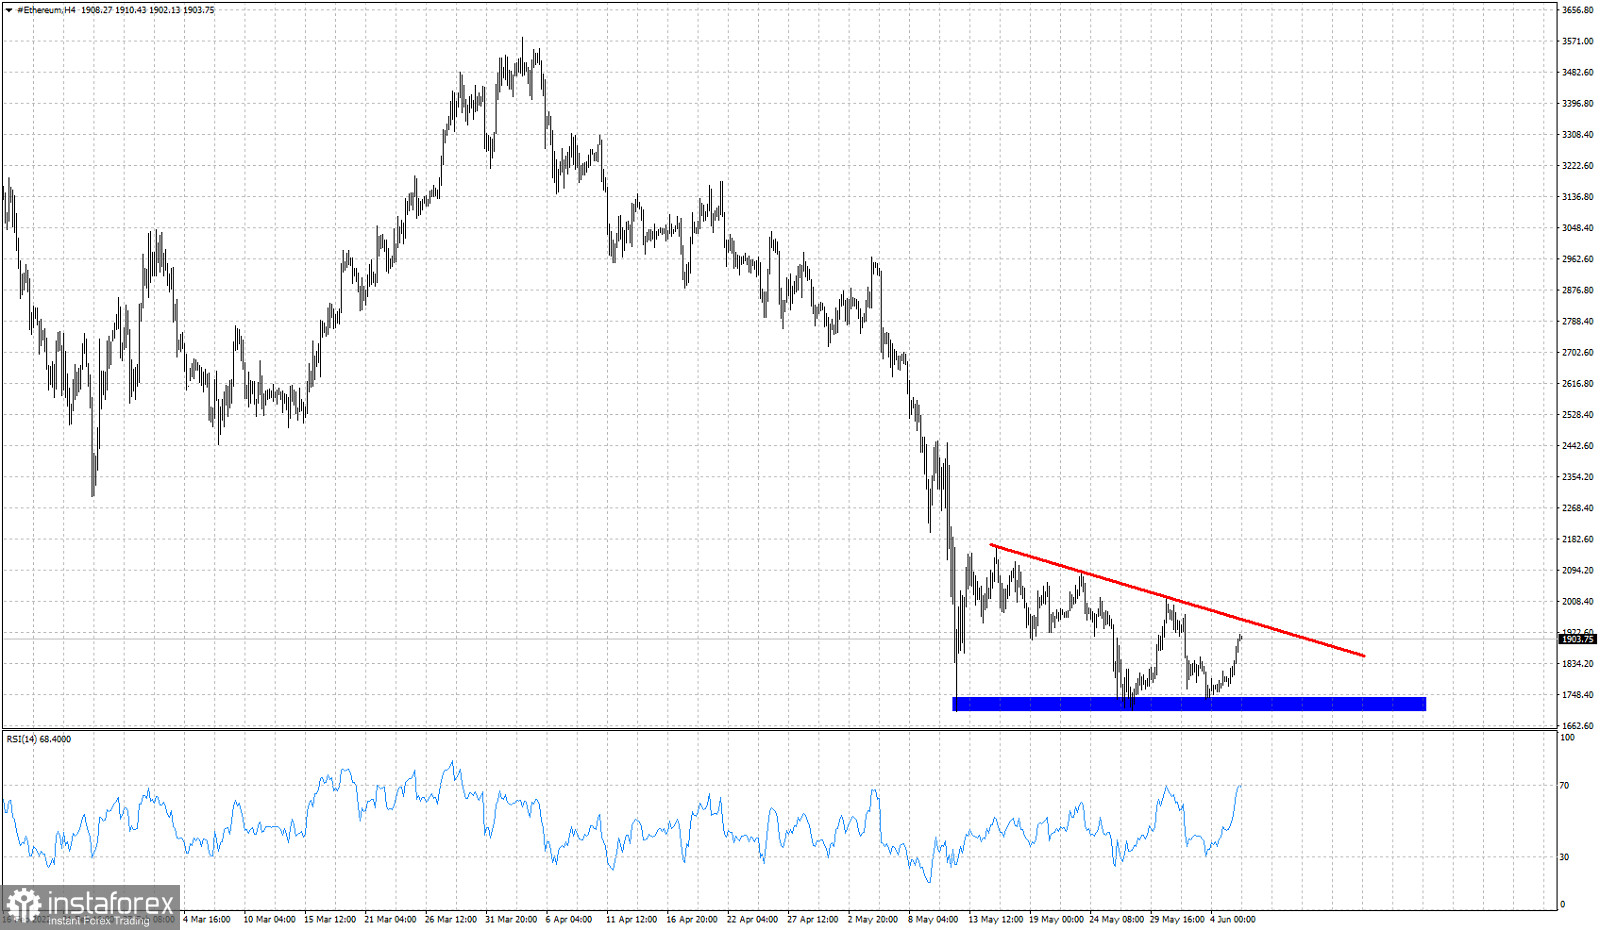
Blue rectangle- horizontal support
Price bounced off the horizontal support for the third time. Price is still below the red downward sloping resistance trend line. Price remains below the recent lower high that was formed at $2.015 back in May 31st. Ethereum is approaching key short-term resistance levels. A rejection here will open the way for another test of the horizontal support at $1,700. Bulls do not want to see price break that support level. It would be an important defeat for them.


