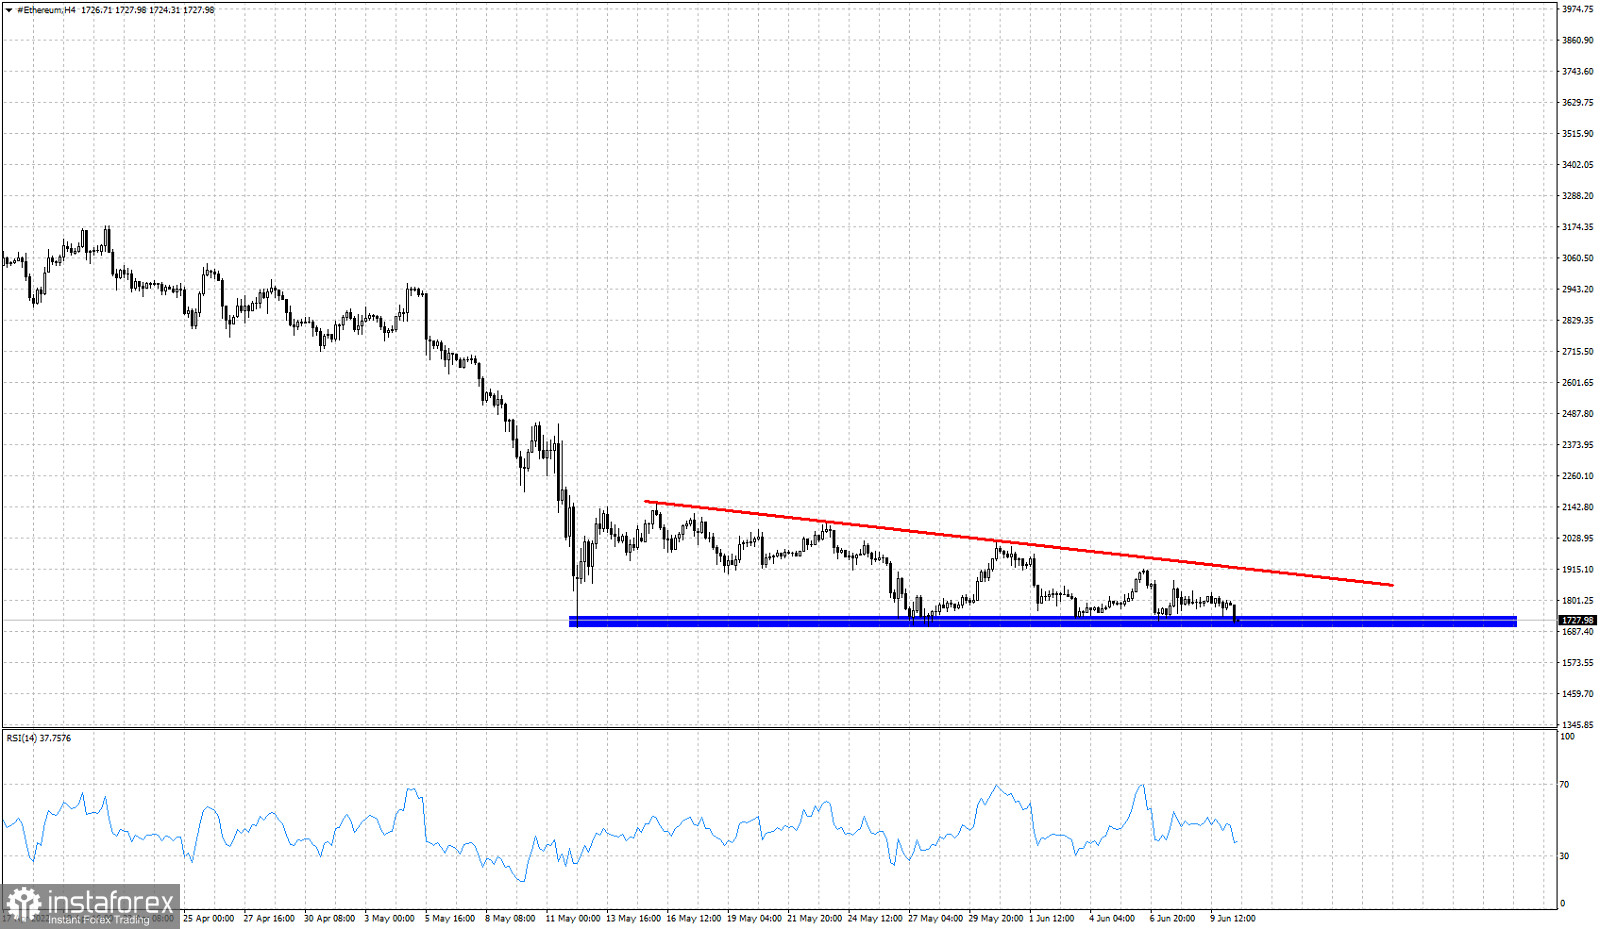
Red line - resistance
Blue rectangle- horizontal support
Ethereum is trading right above the key horizontal support of $1,700. Short-term trend remains bearish and price continues making lower highs as the descending triangle pattern suggests. We talked about this bearish formation before. Price is now on the verge of giving us a new bearish signal. If price breaks below the blue rectangle area, we will get a bearish signal and this would imply that Ethereum can continue lower towards $1,500 at least. Resistance remains key at the red trend line at $1,900-$1,910. As long as price is below this level, bears have the upper hand.


