


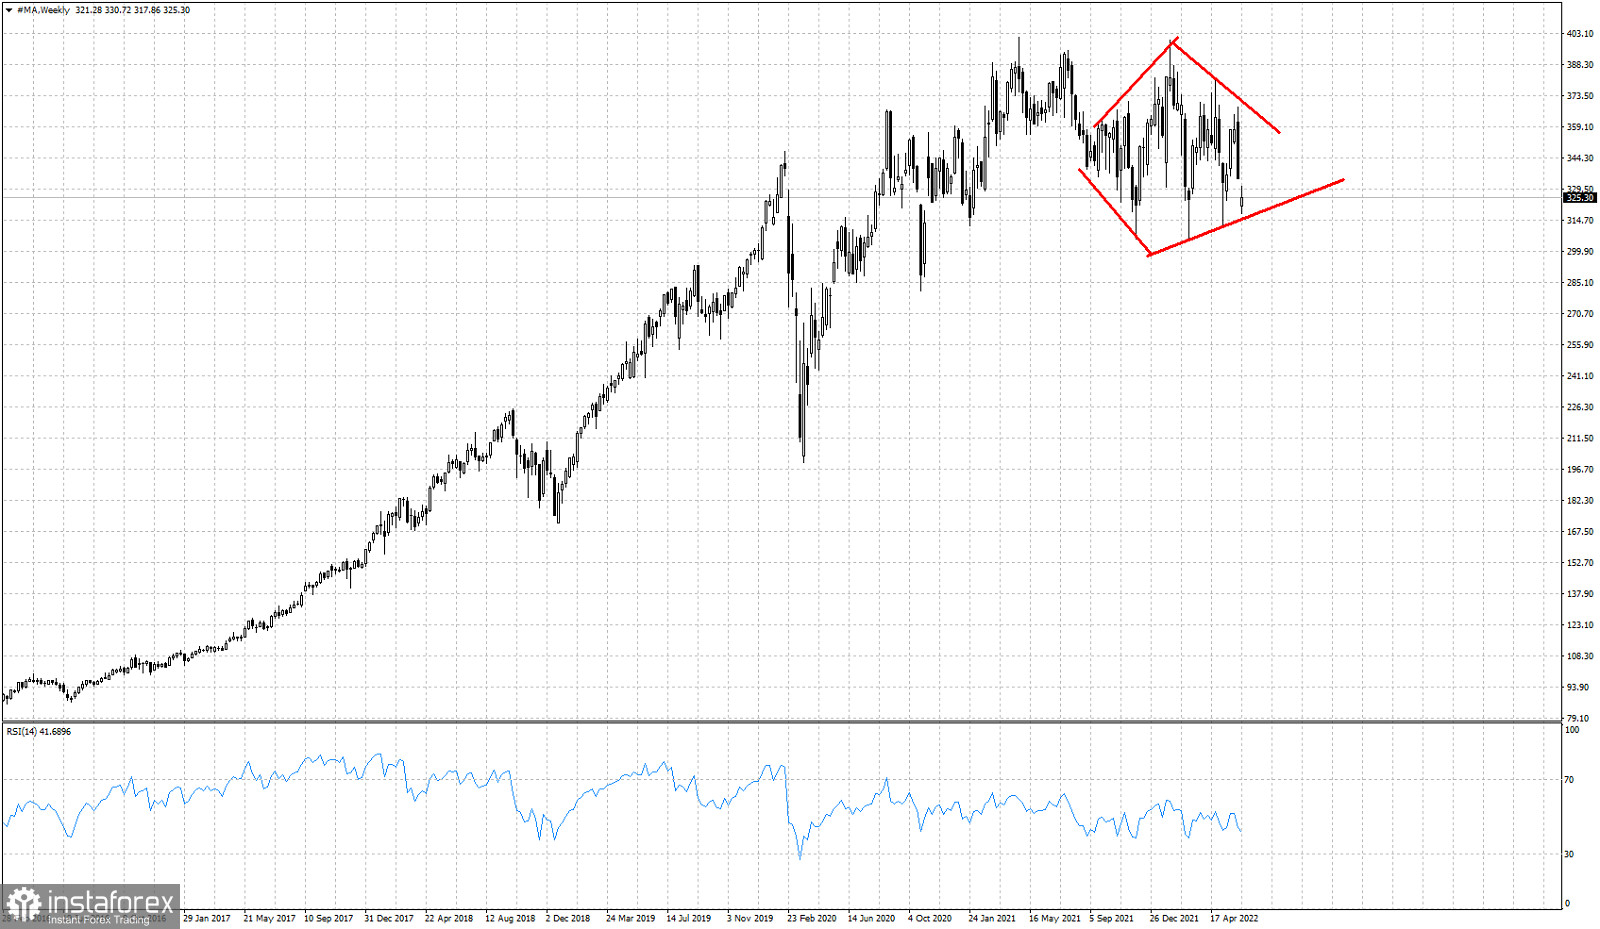
Red lines- diamond pattern boundaries
In the weekly chart of MA stock price we have identified a price pattern that if met near the highs of a trend, usually indicates increased chances of a bearish reversal. In MA weekly price chart we have identified a bearish diamond pattern. Price is now challenging the lower boundary of the pattern. Support is found at $314. There are increased chances, if support is respected, for price to bounce higher towards the upper boundary resistance at $362. Failure to hold above $314, will be a bearish signal and activation of the bearish pattern. Price will then be expected to decline towards $220-$240 area.


