


Bitcoin (BTC/USD) traded the first half of 2022 with a strong bearish bias and the outlook is not good. With record negative returns, BTC is likely to continue falling, especially if it breaks a key support level at 18,750.
The price of Bitcoin plunged 57% in the second quarter, which is the largest accumulation of negative returns in a second quarter in the last 11 years. Despite this, the price has been oscillating in a tight range from 18,750 to 21,875 and below the 200 EMA located at 23,284 in the last few weeks.
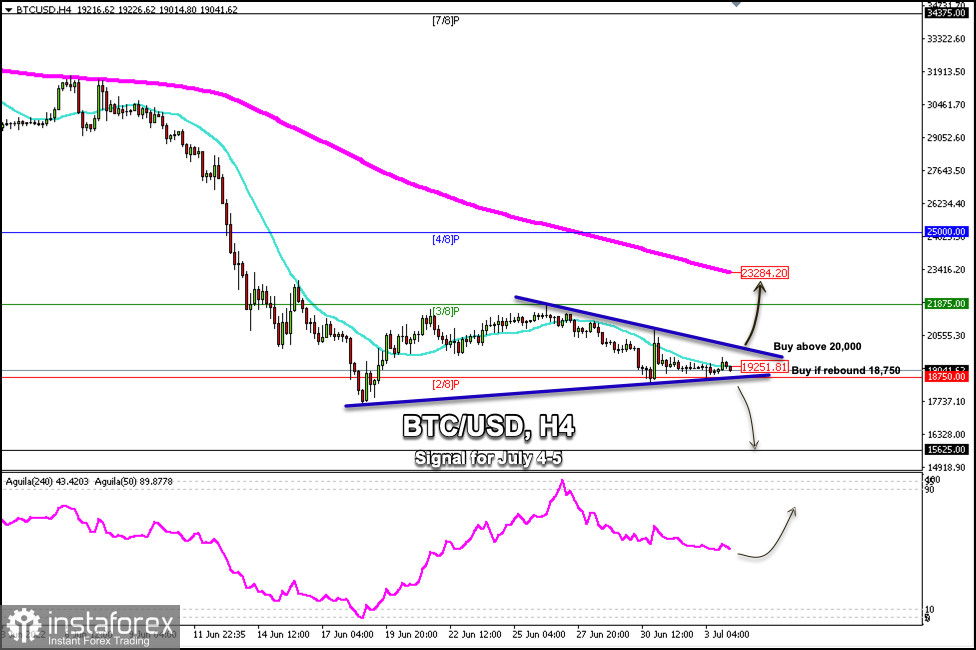
According to the 4-hour chart, we can see the formation of a falling wedge technical pattern, which could suggest a bullish opportunity for BTC and it could reach the 200 EMA around 23,284.
On the other hand, a sharp break below this technical pattern and a daily close below 0/8 Murray at 18,750 could accelerate the bearish move and the price could hit 1/8 Murray at around 15,625.
A sharp break above the downtrend channel could be a signal for Bitcoin to continue its upward move. If this scenario is confirmed, we will be able to trade above the psychological level of $20,000.
Our trading plan for the next few hours is to expect Bitcoin to oscillate within the wedge pattern. A sharp break in either direction of this technical pattern will be the signal to buy or sell.


