


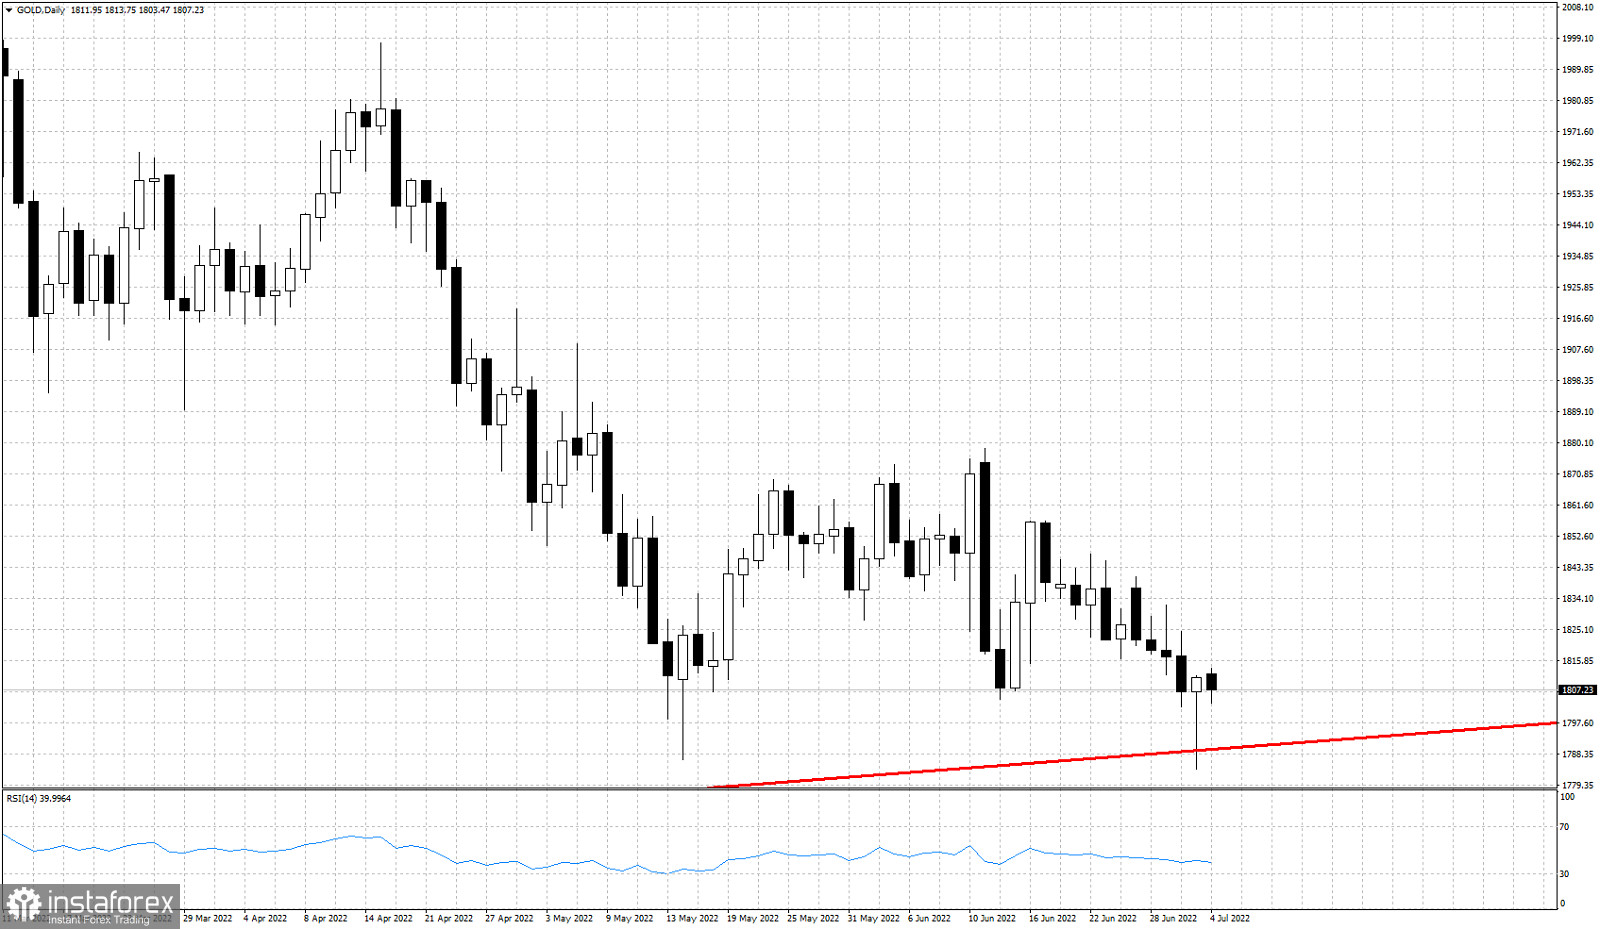
Red line - major support trend line
Gold price is trading around $1,800. Last week price broke below key support of $1,800 but bulls stepped in and pushed price above $1,850, creating a long-tailed bullish hammer candlestick pattern. This candlestick pattern is usually a bullish sign but we need confirmation from the next two candlesticks. So far today's candlestick is not confirming the bullish reversal and bounce off $1,800. Gold has resistance now at $1,820. Bouncing off $1,790-$1,800 and respecting support is a good sign. But Gold bulls will need to continue defending this key support area. Inability to push above $1,820 and break above short-term resistance, will be a sign of weakness and will increase chances of breaking below $1,800 again. Although it is not clear yet if we will continue lower, because support is respected, upside action is also not ideal in order to expect more upside. Traders need to remain patient and cautious.


