


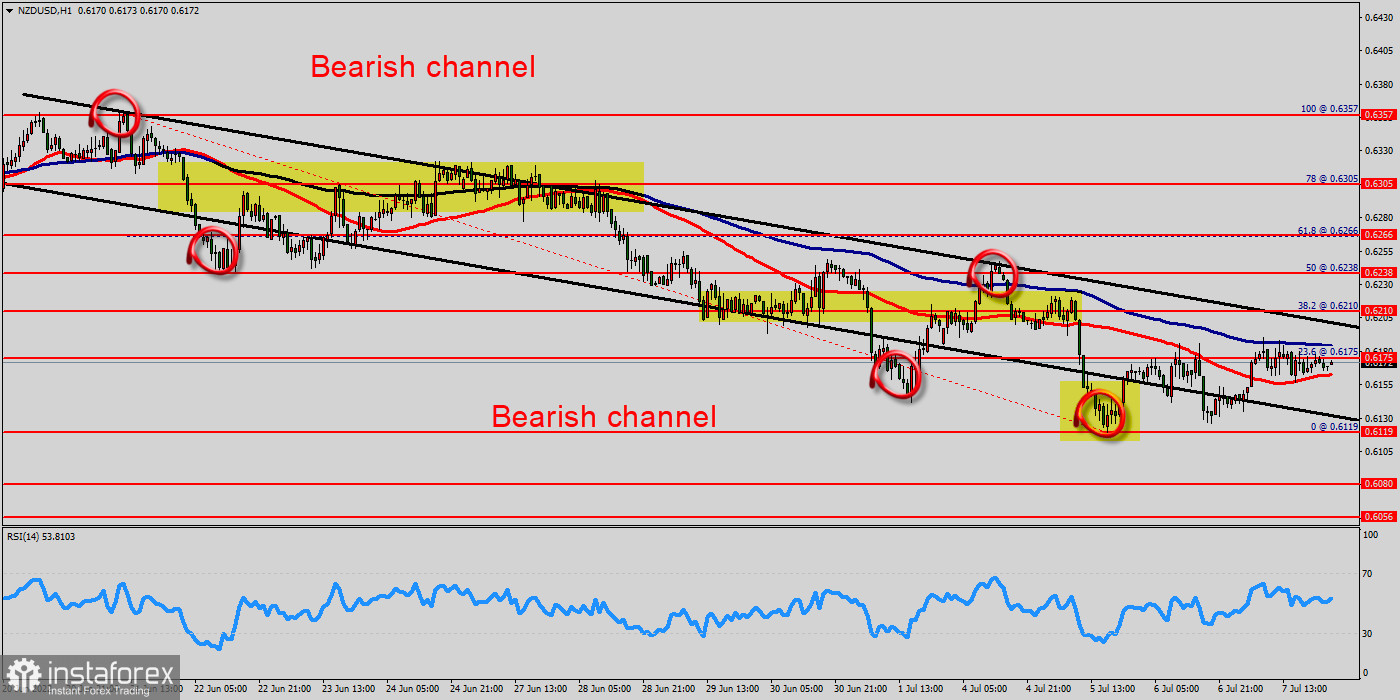
The NZD/USD pair dropped from the level of 0.6357 to the bottom around 0.6119. But the pair has rebounded from the bottom of 0.6119 to close at 0.6175.
Today, the first support level is seen at 0.6119, and the price is moving in a bearish channel now. Furthermore, the price has been set below the strong resistance at the level of 0.6266, which coincides with the 61.8% Fibonacci retracement level.
This resistance has been rejected several times confirming the downtrend. Additionally, the RSI starts signaling a downward trend. As a result, if the NZD/USD pair is able to break out the first support at 0.6119, the market will decline further to 0.6080 in order to test the weekly support 2.
In the H1 time frame, the pair will probably go down because the downtrend is still strong. Consequently, the market is likely to show signs of a bearish trend.
However, if the pair fails to pass through the level of 0.6210 (major resistance), the market will indicate a bearish opportunity below the strong resistance level of 0.6210 (the level of 0.6210 coincides with tha ratio of 38.2% Fibonacci retracement).
Since there is nothing new in this market, it is not bullish yet. Sell deals are recommended below the level of 0.6210 with the first target at 0.6119 so as to test the double bottom. If the trend breaks the double bottom level of 0.6119, the pair is likely to move downwards continuing the development of a bearish trend to the level of 0.6080 in order to test the weekly support 2.
On the other hand, if the NZD/USD pair fails to break through the weekly pivot point level of 0.6238 today, the market will move upwards continuing the development of the bullish trend to the level 0.6357 (double top).
Remark - tip of trading : A bear market is a period when the price of an asset has fallen by about 20% or more from recent highs. At this point, the investor fear index increases and panic is possible in the market. A bear market is the same as a bear market, it is also called a downtrend. It is opposed to a bull market. Bullish - vice versa.


