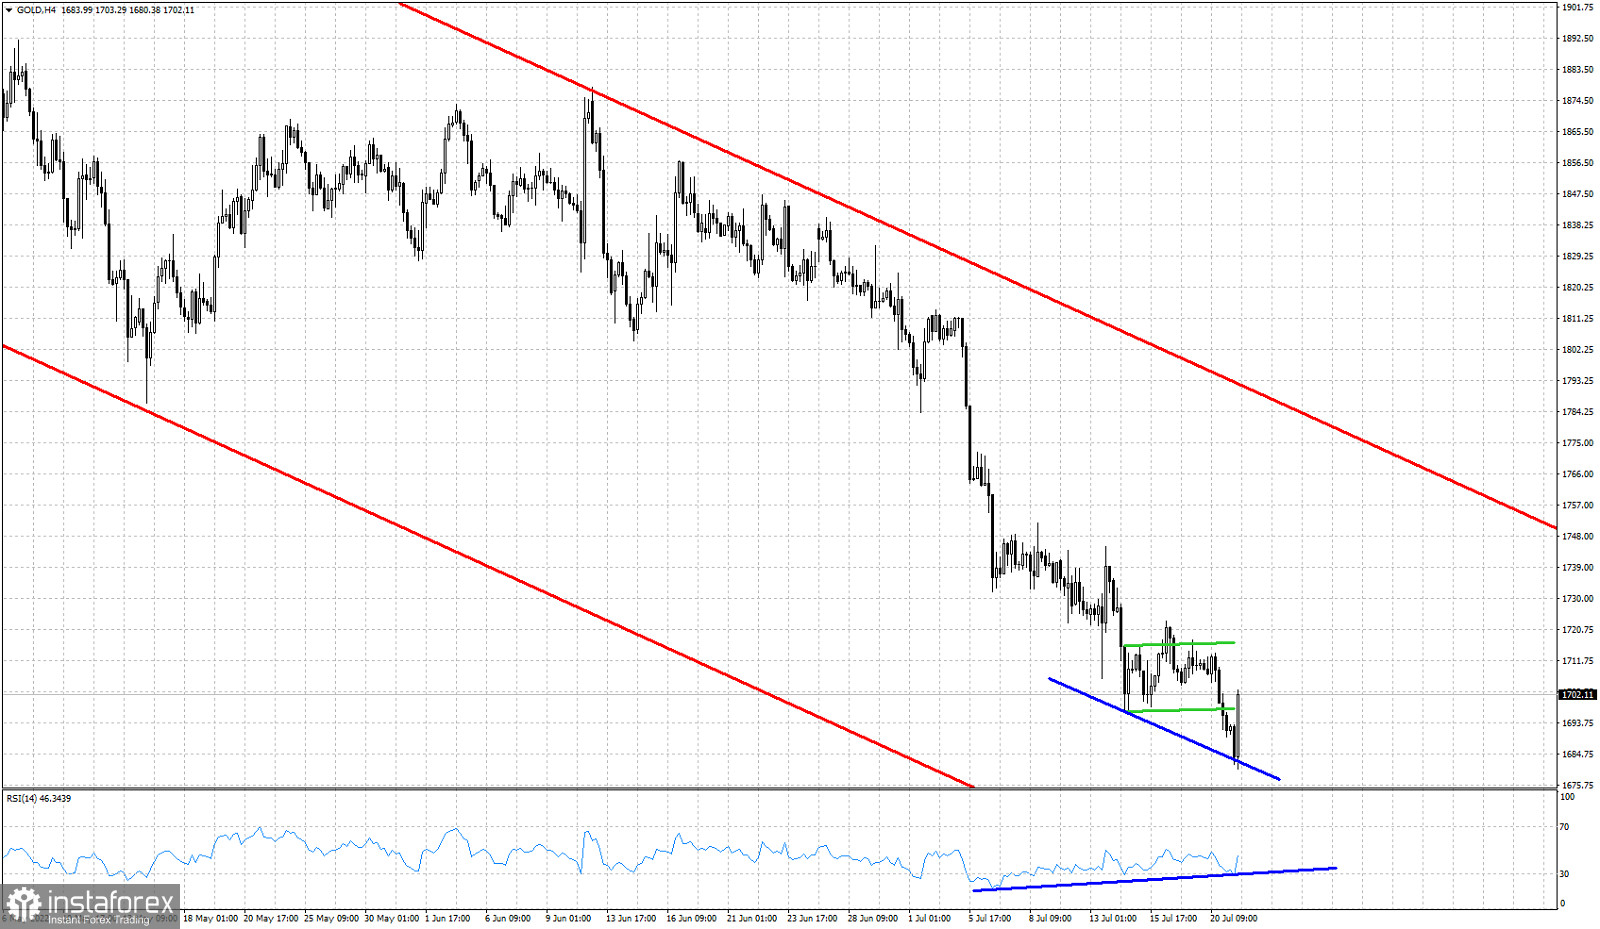
Red lines- bearish channel
Blue lines- bullish RSI divergence
Green lines- short-term trading range
Gold price earlier today broke below the short-term trading range it was in and pushed price below $1,700. As we mentioned in a previous analysis, a break of the trading range would bring Gold price below $1,700 towards $1,690 at least. Today Gold price made a new lower low at $1,680. Despite making a new lower low, the RSI did not follow and formed a higher low. This was a bullish divergence. Down trend is weakening. Gold price justifies a bounce higher. Although Gold remains inside the medium-term red bearish channel, price has potential to bounce towards $1,770.


